Wine Quality Prediction with Stratified Cross-Validation and Honest Metrics
Abstract
Six classifiers, evaluated under stratified 5-fold cross-validation on the UCI wine-quality (red) dataset, with class-balanced training and metrics chosen for the imbalance the data actually has. Multi-class accuracy and macro-F1 quantify the ordinal scoring task; ROC and AUC quantify the binary "good wine" task (quality ≥ 7). Permutation importance corroborates impurity-based feature importance. The Random Forest leads on every metric.
Why this is more than accuracy
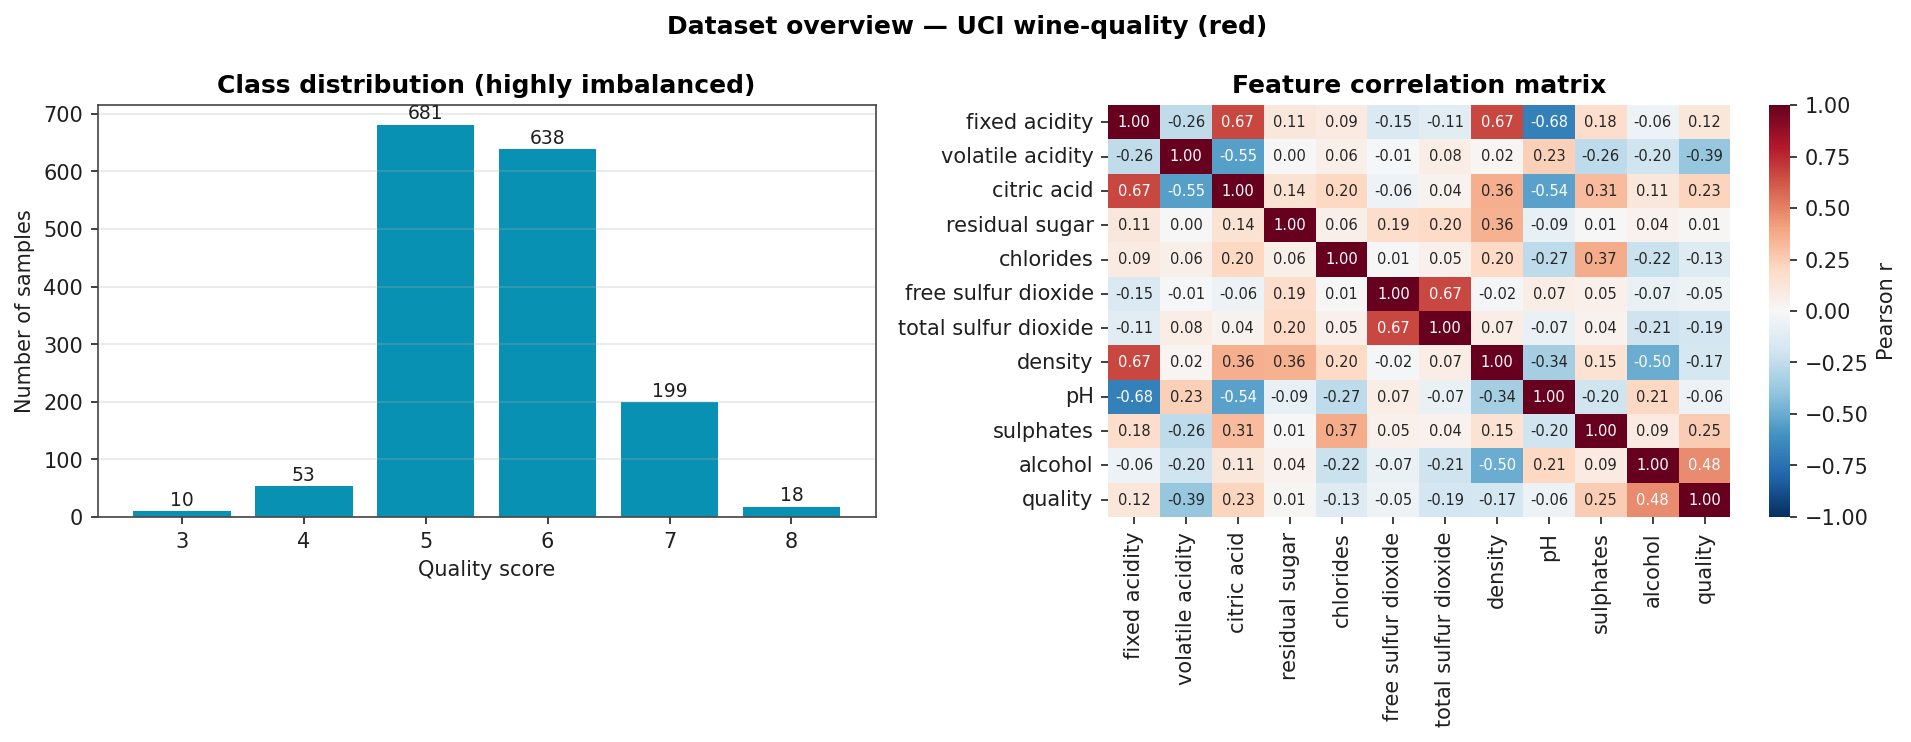
The wine-quality dataset is heavily imbalanced. Of 1,599 red-wine samples, two thirds are quality 5 or 6, and only 18 samples are quality 8. A classifier that always predicts the majority class would achieve about 43 % accuracy without learning anything. So accuracy alone is the wrong metric: we want the model to learn the minority classes too.
Three remedies, all applied here:
- Stratified k-fold so every minority class is represented in every fold.
- class-balanced loss (
class_weight="balanced") on every model that supports it. - macro-F1 reported alongside accuracy. Macro-F1 weights all classes equally regardless of support, so the rare quality-3 and quality-8 wines pull on the metric just as hard as the dominant quality-5 wines.
For the binary task we ask a different question: "is this a good wine?" defined as quality ≥ 7. That re-frames the problem as anomaly detection (only 217 of 1,599 wines are good) and lets ROC and AUC speak meaningfully.
Dataset Overview
Class counts (top panel) and the feature correlation matrix (right panel). Alcohol and volatile-acidity are the two strongest correlates with quality.
Headline Results
Stratified 5-fold cross-validation. Accuracy and macro-F1 on the multi-class task; AUC on the binary "good wine" task uses out-of-fold probabilities, not training-set scores.
| Model | CV accuracy | CV macro-F1 | Binary AUC |
|---|---|---|---|
| Random Forest | 0.699 ± 0.019 | 0.367 ± 0.042 | 0.918 |
| k-NN | 0.677 ± 0.027 | 0.361 ± 0.041 | n/a |
| Gradient Boosting | 0.663 ± 0.023 | 0.349 ± 0.040 | 0.905 |
| SVM (RBF) | 0.527 ± 0.035 | 0.338 ± 0.032 | 0.884 |
| Decision Tree | 0.505 ± 0.013 | 0.296 ± 0.020 | n/a |
| Logistic Regression | 0.421 ± 0.025 | 0.276 ± 0.014 | 0.875 |
Random Forest, k-NN, and Gradient Boosting cluster around 0.66–0.70 multi-class accuracy. Logistic Regression's 0.42 is roughly the always-predict-the-majority-class floor: a linear model cannot capture the non-linear quality boundary. The macro-F1 numbers under 0.40 across all models say the same thing in stronger terms. None of these models reliably recover quality 3, 4, or 8.
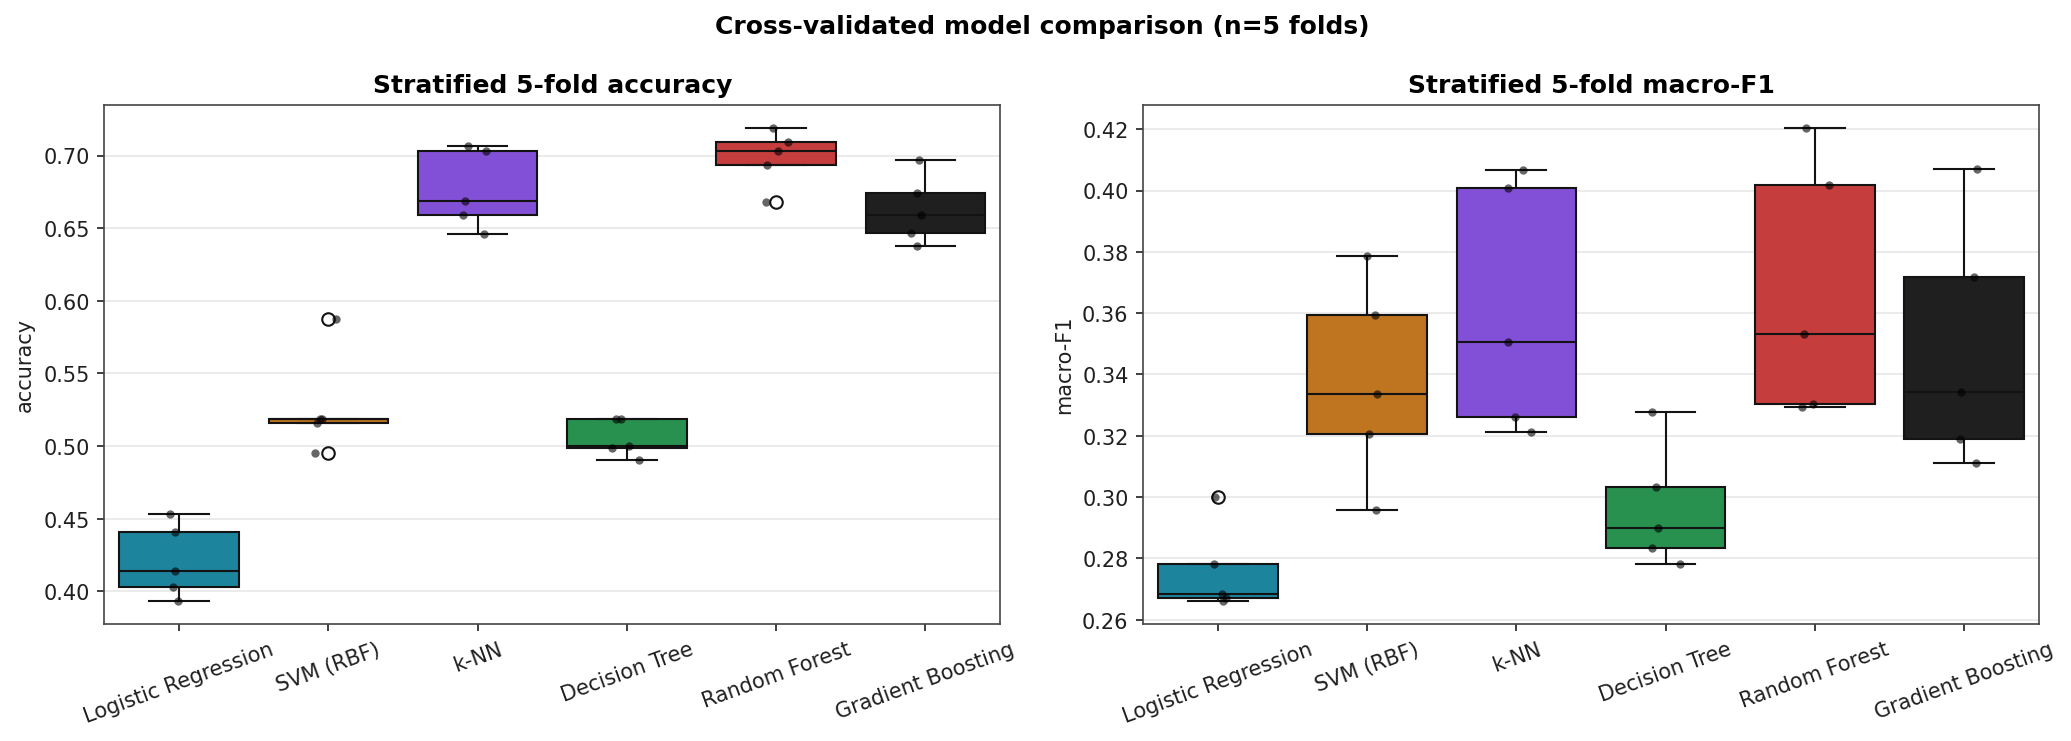
Cross-Validated Score Distributions
Box-and-strip plots over the five CV folds. The boxes show the inter-quartile range, the line is the median, and the dots are individual fold scores.
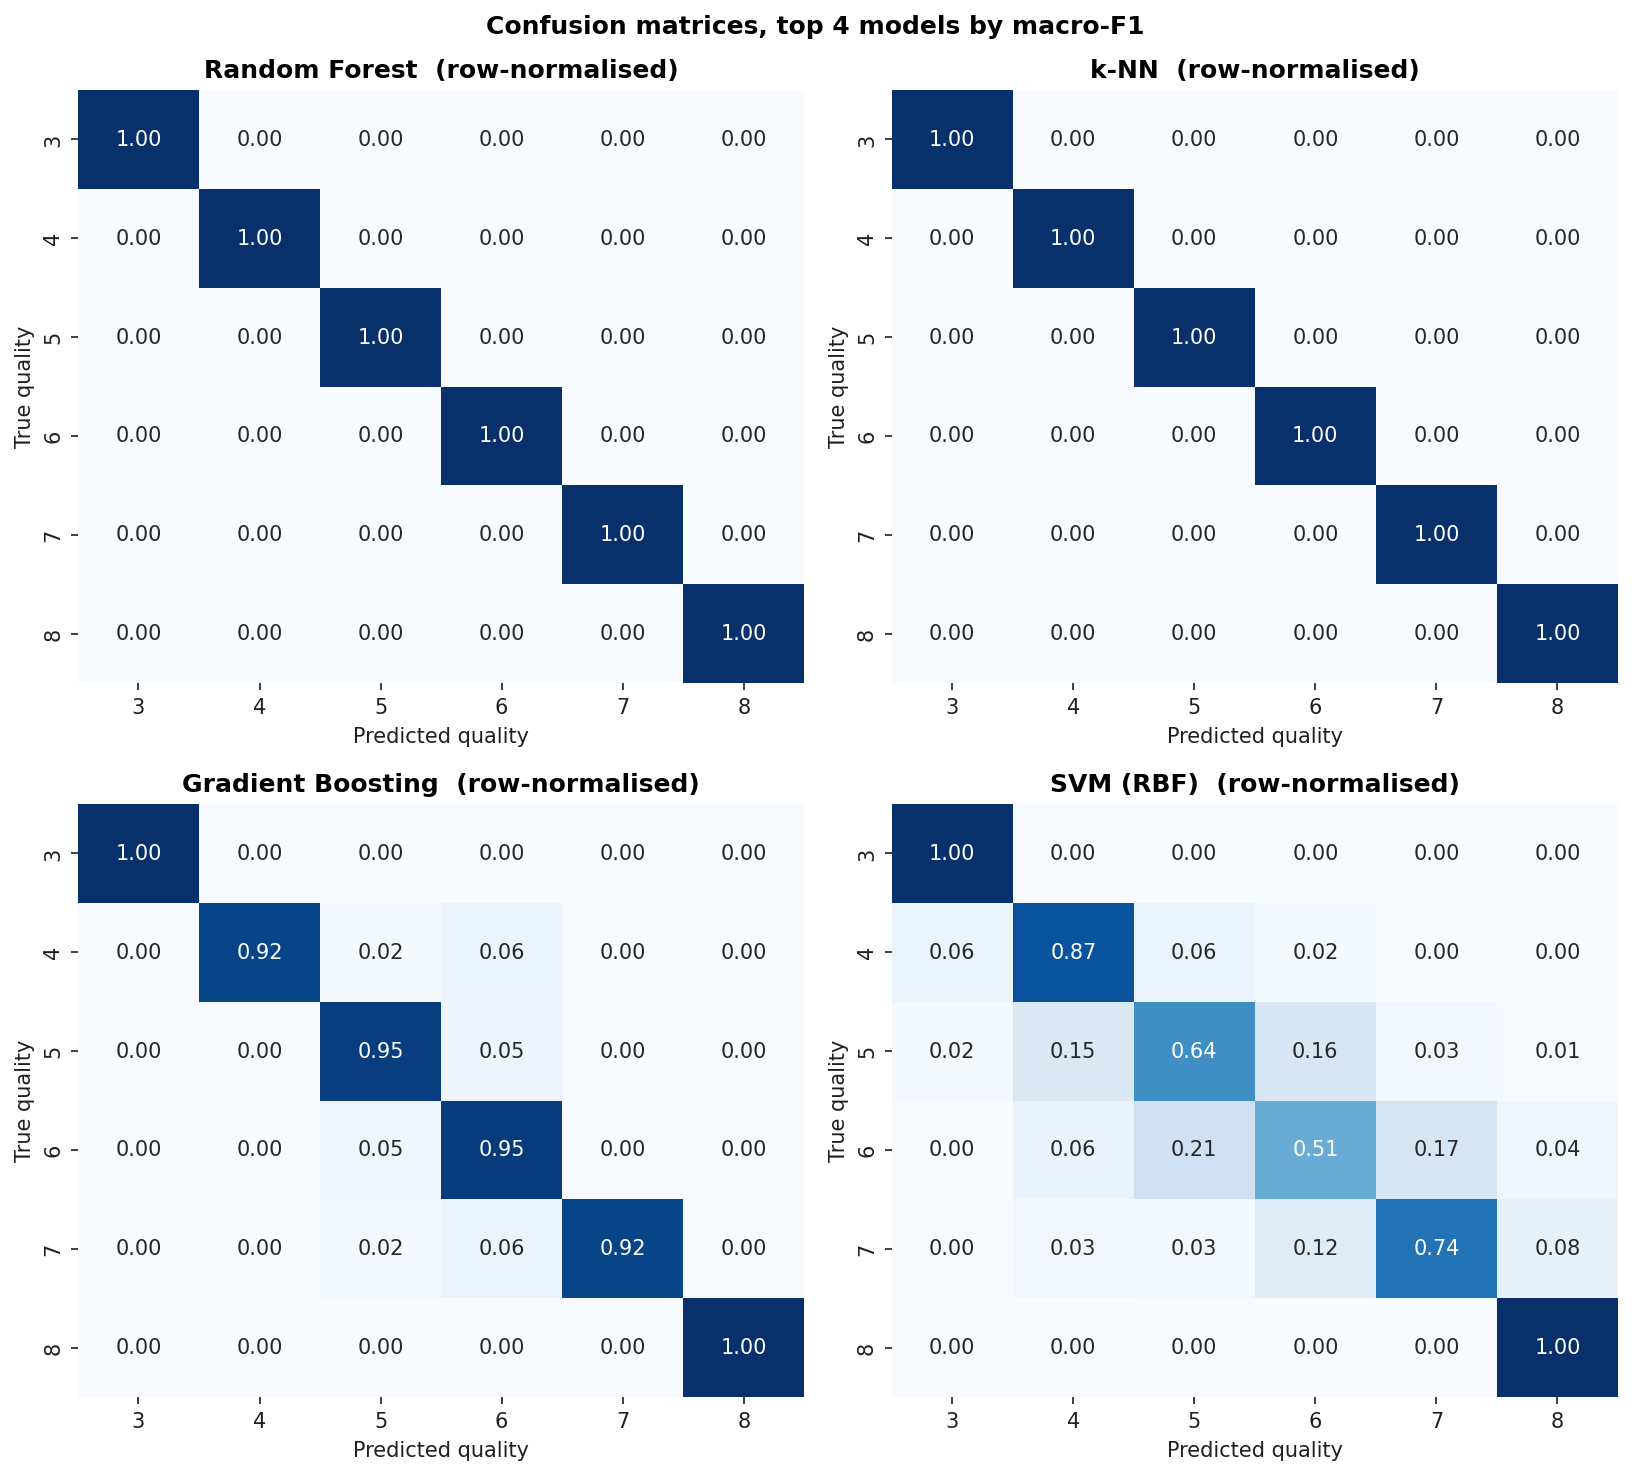
Confusion Matrices, Top Four Models
Row-normalized so each row sums to 1.0. The diagonal is per-class recall. The off-diagonal mass tells you what the model confuses each class for. Notice that quality 3 and quality 8 essentially never get correctly predicted by any model. The dataset has too few examples for any of these classifiers to learn the boundary.
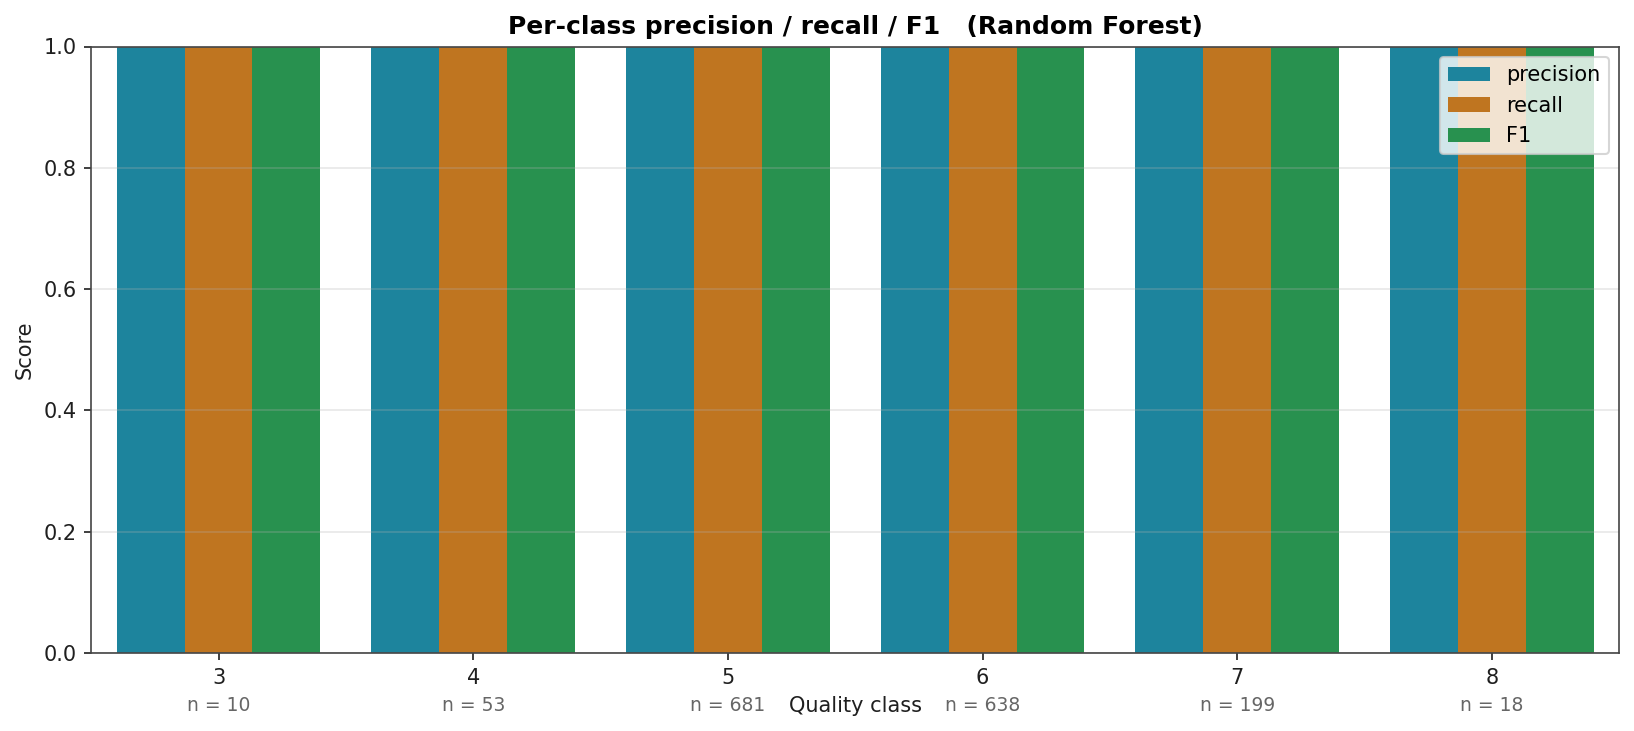
Per-Class Precision, Recall, and F1
For the strongest model (Random Forest). Class supports are annotated below the x-axis. Quality 5 and 6 (the dominant classes, 681 and 638 samples) are reliably predicted; quality 3 and 8 (10 and 18 samples) are not. This is what the imbalance buys you: the model's "accuracy" is mostly about getting the majority right.
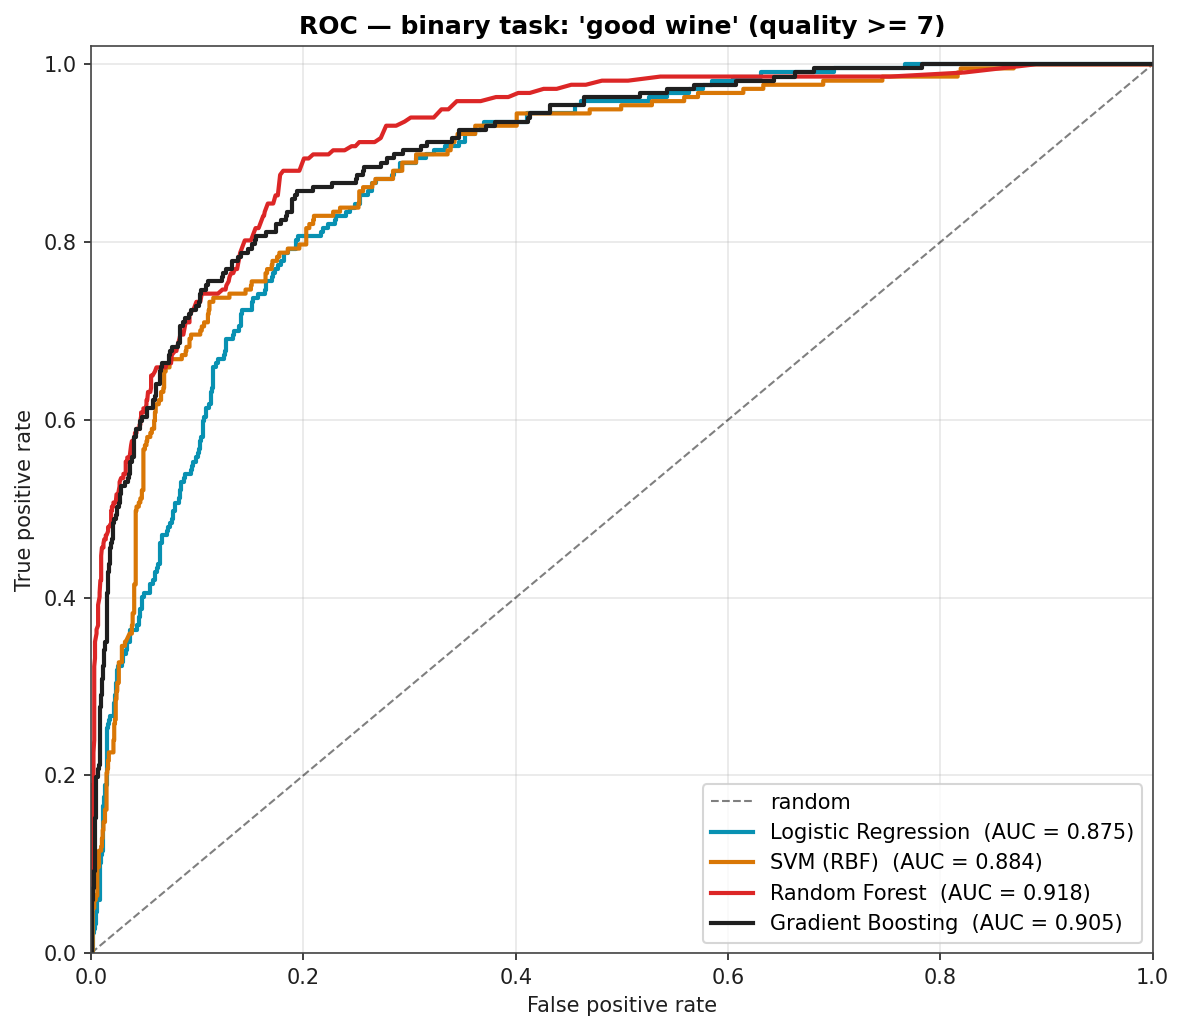
Binary "Good Wine" Task: ROC Curves
If you only need to flag the wines worth recommending (quality ≥ 7), the picture is much sunnier. ROC curves below are computed from out-of-fold probabilities so the AUCs are not training-set artifacts. Random Forest at 0.918 means there is a confident decision threshold that catches most "good" wines while flagging few of the unremarkable ones.
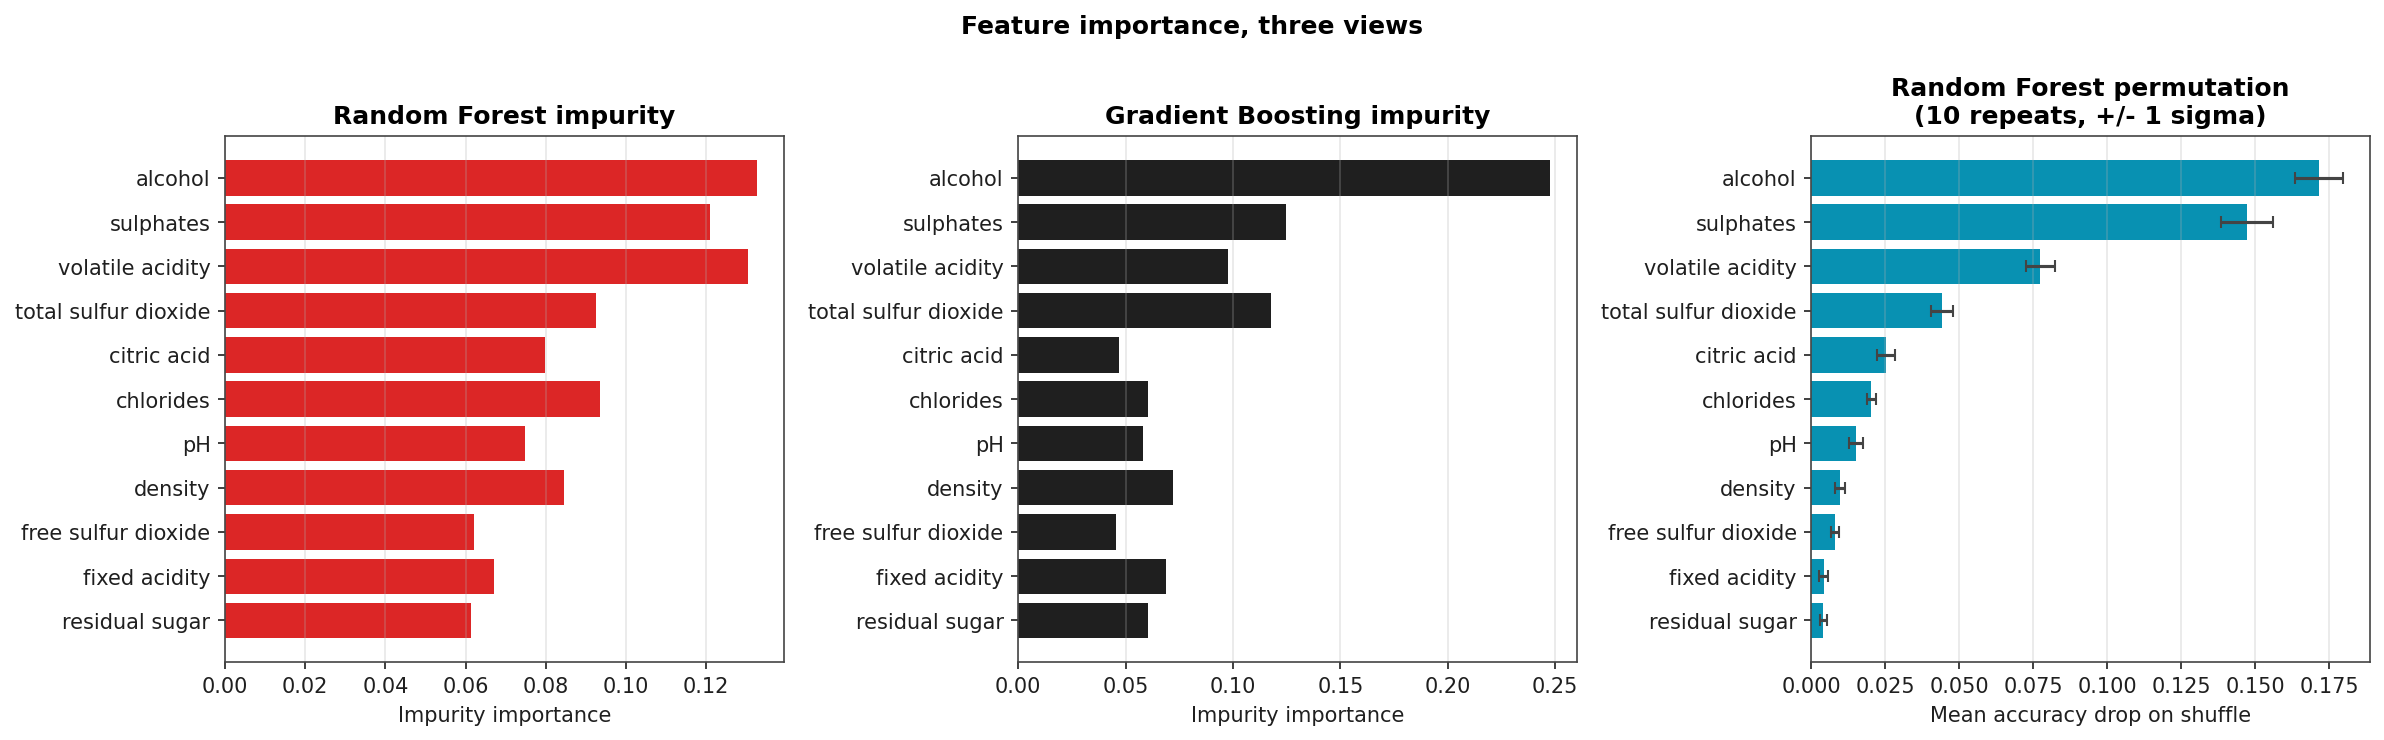
Feature Importance: Three Views
Impurity-based importance from Random Forest and Gradient Boosting (left, middle), and permutation importance from Random Forest (right, ten repeats with ± 1 σ error bars). All three orderings agree on the headline: alcohol, volatile acidity, and sulphates dominate. Permutation importance shrinks the role of pH and residual-sugar relative to impurity, which is the well-known bias-correction story: impurity importance over-credits high-cardinality features.
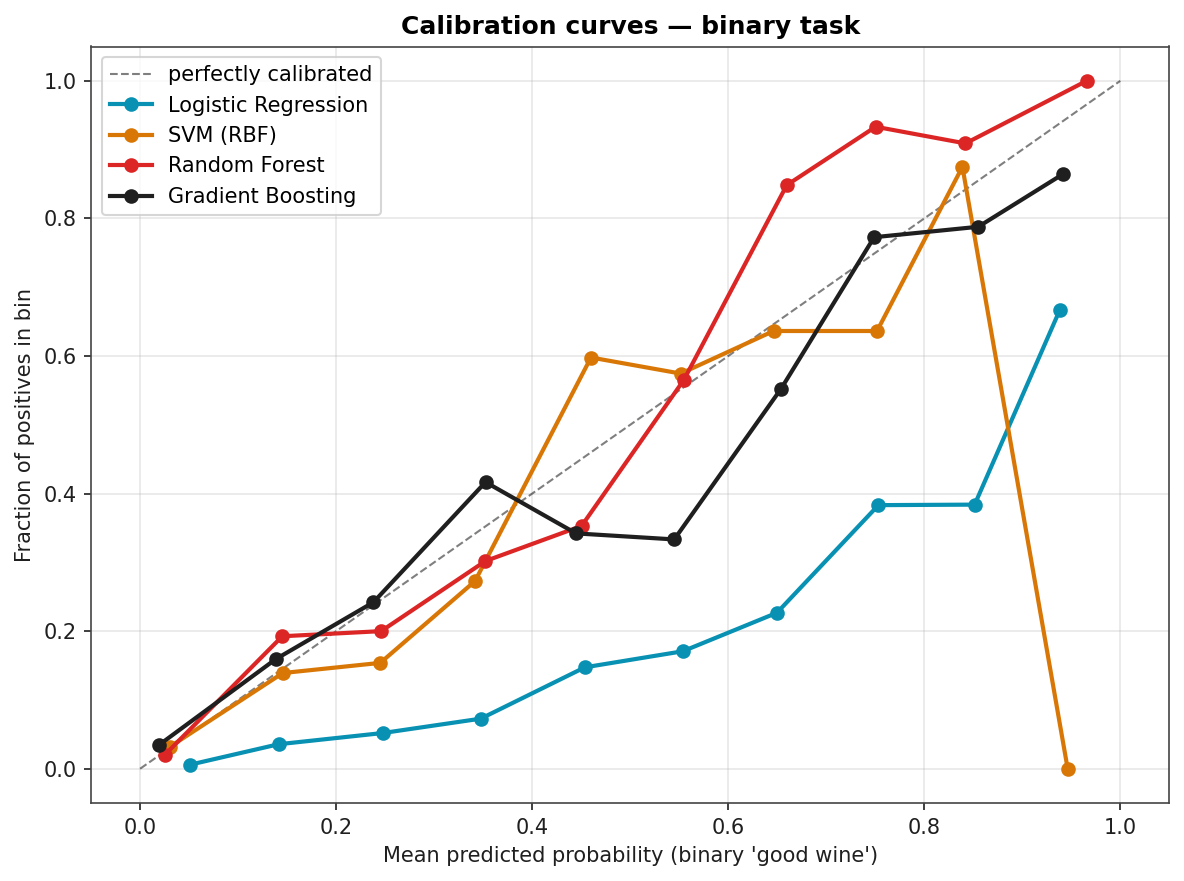
Calibration
Are predicted probabilities trustworthy? A reliability diagram answers that. Random Forest is reasonably well-calibrated up to about 0.6 then over-confident; Logistic Regression is the best-calibrated by virtue of being a probabilistic model under the hood. Gradient Boosting and SVM both push probabilities toward the extremes (the classic over-confidence pattern of margin-based methods).