Iris Classification: A Tight Benchmark Study with Honest Caveats
Abstract
Five classifiers (Logistic Regression, k-NN, RBF SVM, LDA, Random Forest) on Fisher's Iris dataset, evaluated under stratified 5-fold cross-validation. Every model achieves 0.95 to 0.97 accuracy and macro-F1; the differences between them are within one fold's standard deviation. The point of the study is therefore not "which model wins" but to make the reasons Iris is so easy explicit, with a PCA visualisation, a decision-boundary plot on the canonical petal-length / petal-width pair, and a per-class breakdown of the residual error.
Why Iris is "easy"
Three reasons the dataset is a poor benchmark for distinguishing modern classifiers:
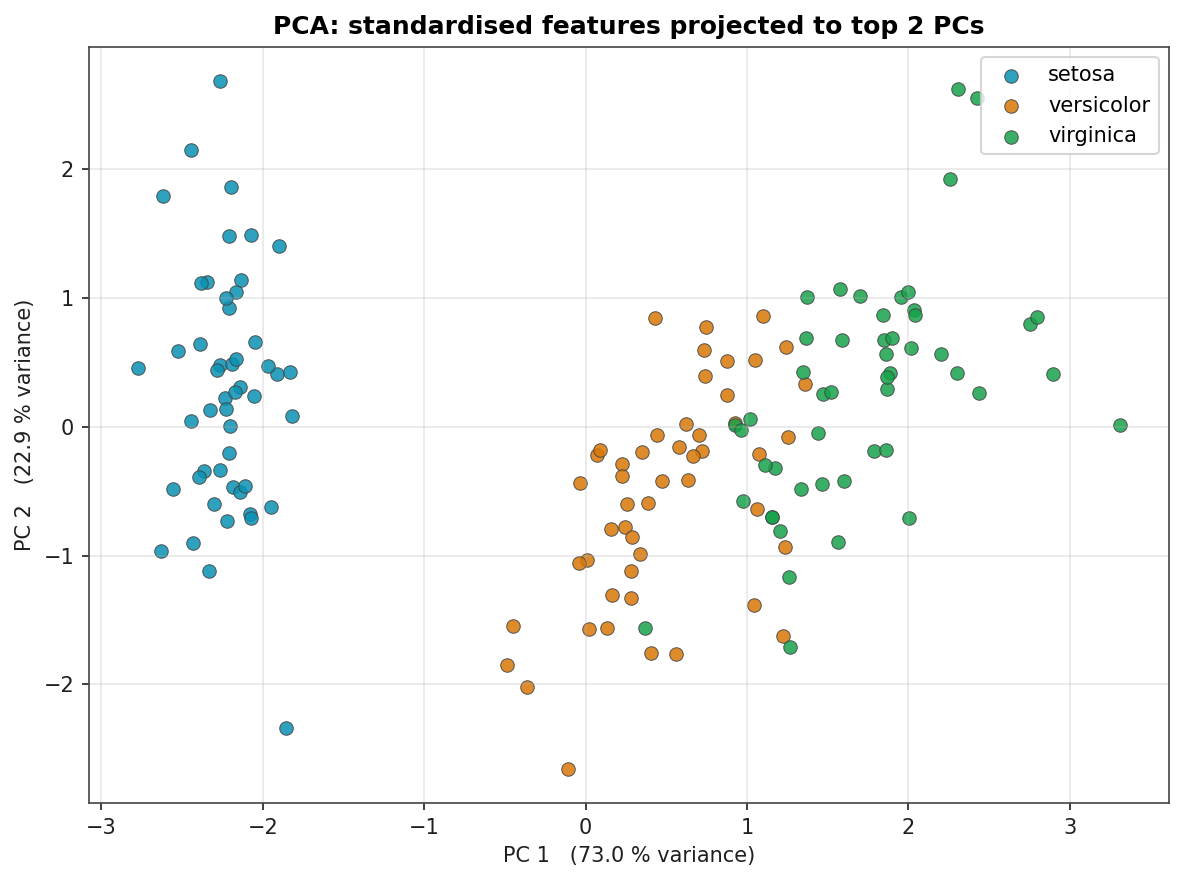
- Setosa is linearly separable from the other two species. The PCA plot below shows it sitting in its own region of the projected feature space. Any reasonable model gets it perfectly.
- The petal features are almost sufficient on their own. The pairwise plot of petal length vs petal width shows clear class structure; the sepal features add only marginal information.
- The dataset is small (150 samples, 50 per class). Variance across folds is dominated by sampling noise, not model capacity differences.
This page reports the numbers honestly and uses the dataset to illustrate methodology rather than make claims about model superiority.
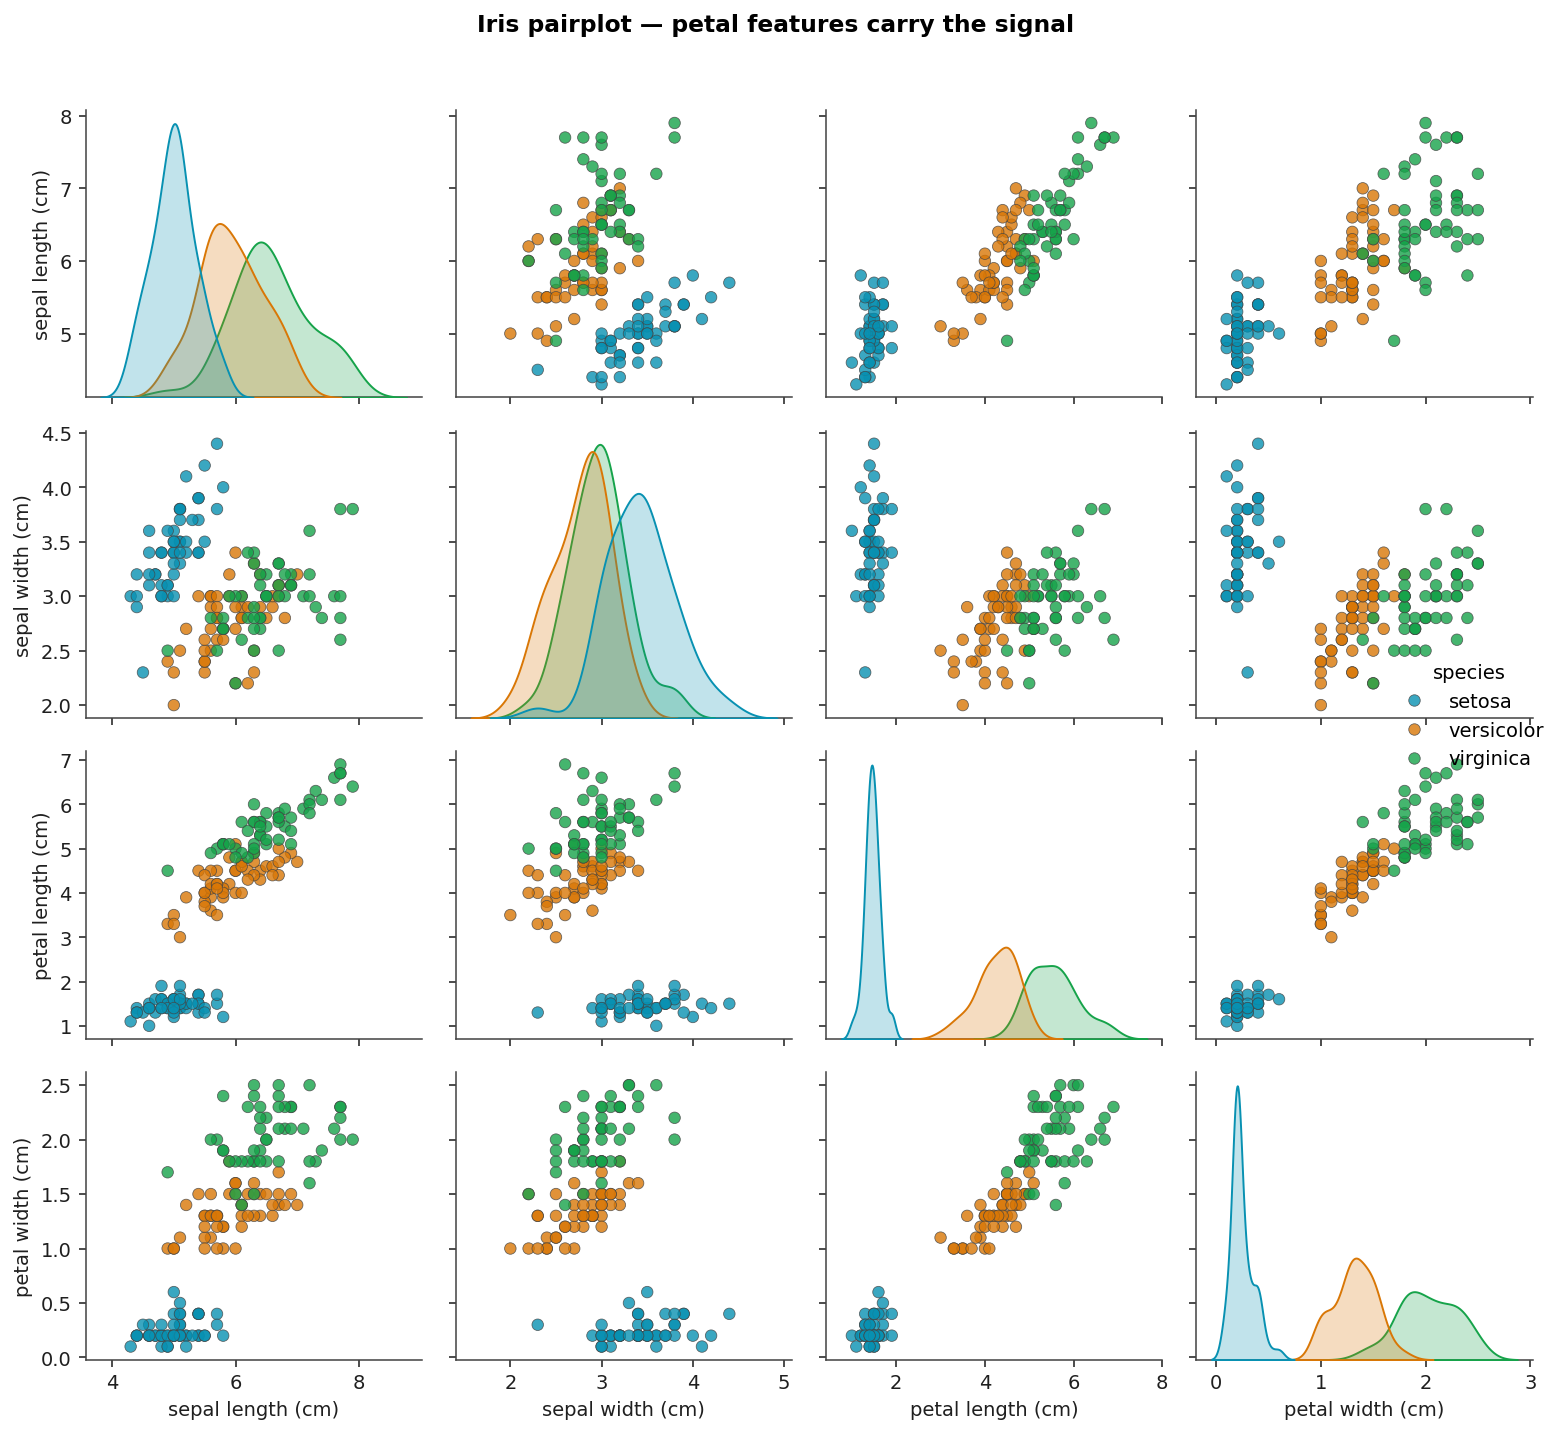
Pairplot
Pairwise distributions across the four features, coloured by species. Petal length and petal width carry most of the signal; the sepal pair has overlap between versicolor and virginica.
PCA Projection
Standardised features projected onto the first two principal components. PC 1 captures about 73 % of the variance and aligns with petal length / petal width; PC 2 captures another 23 %. Setosa is fully separated from the other two species in this 2-D projection. The remaining classification problem is the boundary between versicolor and virginica.
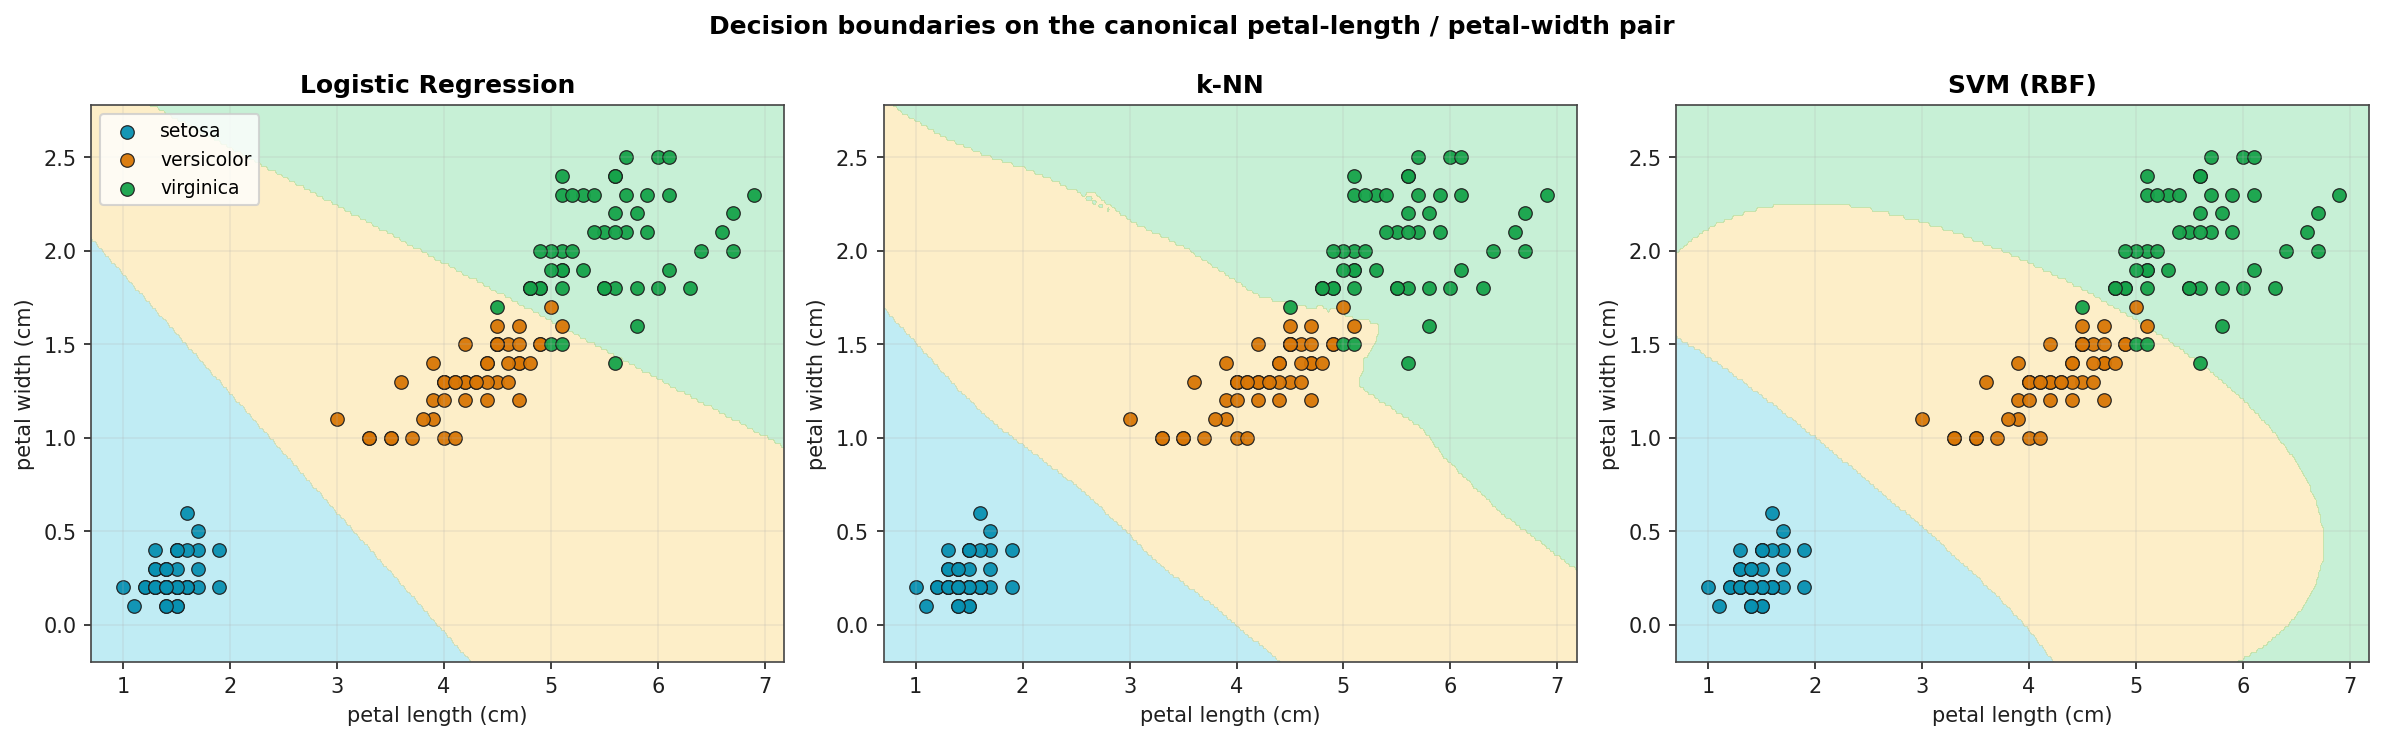
Decision Boundaries on Petal-Length vs Petal-Width
Three classifiers trained on the canonical 2-D feature subspace and visualised on a fine grid. Logistic Regression and LDA produce linear boundaries; k-NN's boundary is piecewise; SVM with the RBF kernel produces a smooth non-linear boundary. All three resolve setosa cleanly; all three trip on the same handful of versicolor / virginica boundary points.
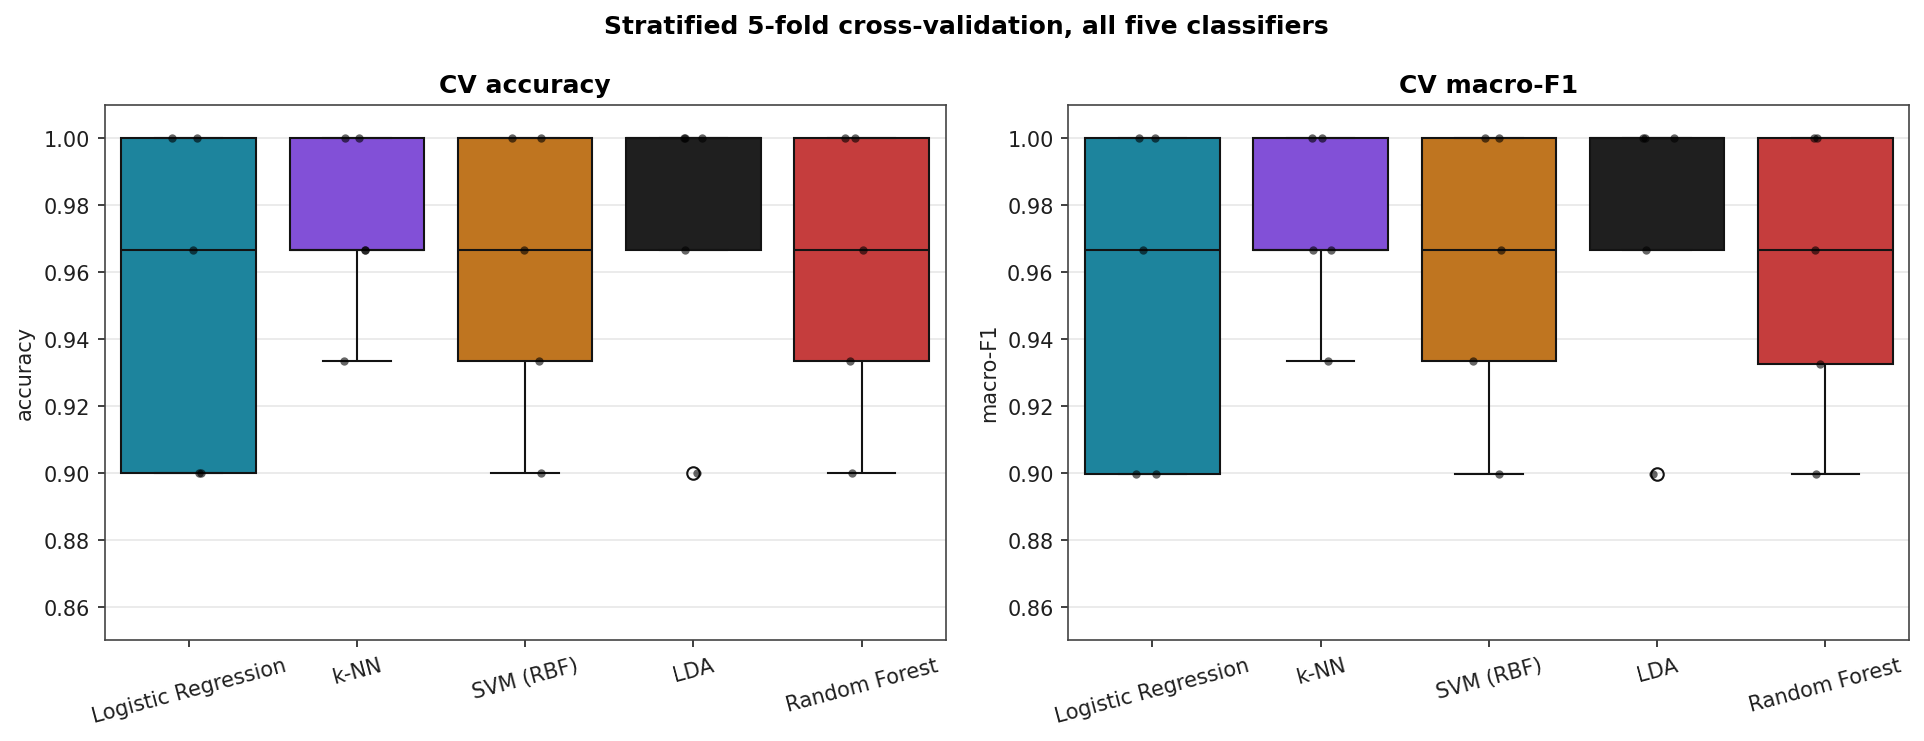
Cross-Validated Headline Results
Stratified 5-fold cross-validation on all four features.
| Model | CV accuracy | CV macro-F1 |
|---|---|---|
| LDA | 0.973 ± 0.043 | 0.973 ± 0.044 |
| k-NN | 0.973 ± 0.028 | 0.973 ± 0.028 |
| Random Forest | 0.960 ± 0.043 | 0.960 ± 0.044 |
| SVM (RBF) | 0.960 ± 0.043 | 0.960 ± 0.044 |
| Logistic Regression | 0.953 ± 0.051 | 0.953 ± 0.051 |
The standard deviations across folds (≈ 0.03–0.05) are larger than the gaps between models. Reading this table as "LDA and k-NN beat the rest" would over-interpret the data.
CV Score Distributions
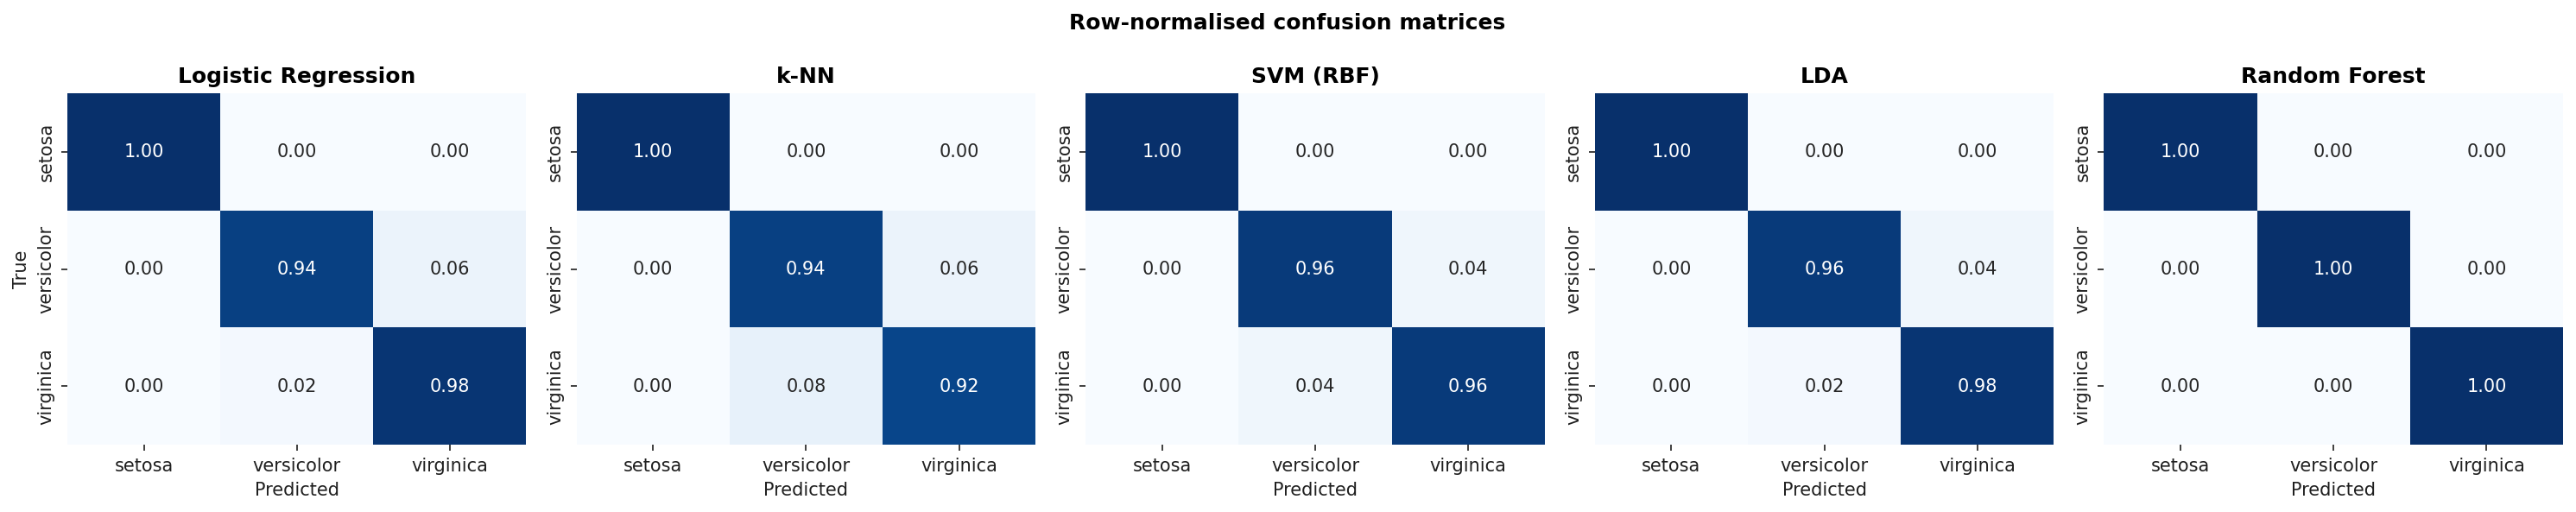
Confusion Matrices
Row-normalised confusion matrices (so each row sums to 1.0). Setosa is perfectly recovered by every classifier; the residual error is on the versicolor / virginica boundary.
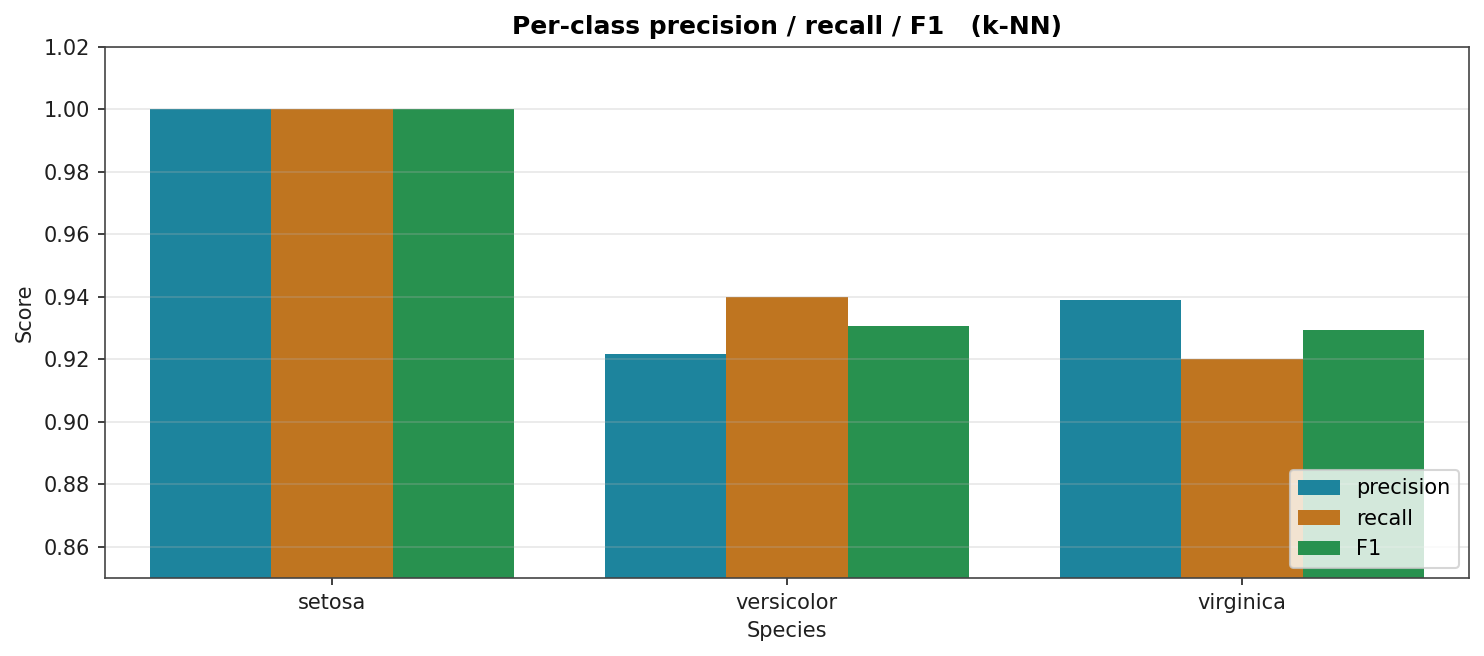
Per-Class Metrics for the Best Model
Precision, recall, and F1 per species for k-NN (one of the two top models). Setosa is at 1.0 across the board; versicolor and virginica each lose a small amount of precision and recall to the other.
A note on benchmarking
Many published claims about classifiers cite Iris numbers as evidence. The numbers here suggest you should not. With class-balanced 50-sample-per-class data and a partly linearly-separable structure, even Logistic Regression hits 0.95. A more discriminating benchmark would have higher feature dimensionality, more samples, and a non-trivial class boundary. Wine-quality on the next page is one such, with imbalanced classes and an ordinal target.