Autonomous UV-C Sterilization Machine
Abstract
A team Senior Design capstone (UCSD MAE 156B, sponsored by Jeffrey Levitt of Applied UVc) building an autonomous UV-C sterilization fixture for shopping-cart-like contact surfaces. The team's design target was a log-3 reduction (≥ 99.9 % kill) of RNA-virus surrogates. My contributions were the ray-tracing simulation that predicted UV-C dose distribution across the cart geometry and the image-processing pipeline used to quantify dose from indicator-strip photographs after each empirical test run. Together they closed the loop between "what the fixture should deliver" and "what we measured."
UV-C Dose & the Log-Reduction Target
RNA-virus inactivation by UV-C follows a single-hit kinetics model:
N(D) / N_0       =  exp(−k · D)
log10[ N(D)/N_0 ] =  −D · k / ln(10)  =  −D / D_10
Where D = ∫ I(t) dt [mJ/cm²] is the integrated 254-nm fluence and D_10 is the dose for a 1-log reduction (literature values for SARS-CoV-2 and surrogates: 1.7–7.0 mJ/cm² depending on the source). A log-3 reduction therefore requires D ≥ 3 · D_10, with safety margin set by the worst-case material and worst-case geometry. The hard part is not delivering that dose to a flat panel facing the lamp, it is delivering it to handles, undersides, and seam shadows.
Ray-Tracing Simulation
Forward Monte-Carlo ray tracing on a CAD-imported cart geometry. Each lamp face emits ≈ 10⁶ rays per simulation run with cosine-weighted angular distribution; rays are propagated through the chamber and either absorbed at a surface, scattered diffusely (Lambertian for sheet metal, low-albedo for textile handle wraps), or escaped past the chamber boundary. Per-surface incident energy is binned into a UV-C fluence map.
I_surface(x)     ≈  Σ_r  E_r · cos θ_r
D_surface(x)     =  I_surface(x) · t_exposure
log10 reduction  =  D_surface(x) / D_10
The first line bins per-pixel incident fluence over all rays r hitting surface point x; the second integrates over exposure time; the third converts to log-reduction via D_10.
Sweeps over fixture geometry (lamp count, lamp angle, baffle layout) and cycle time identify the configurations that achieve worst-case D ≥ 3 · D_10 on every contact surface inside the manufacturable design envelope.
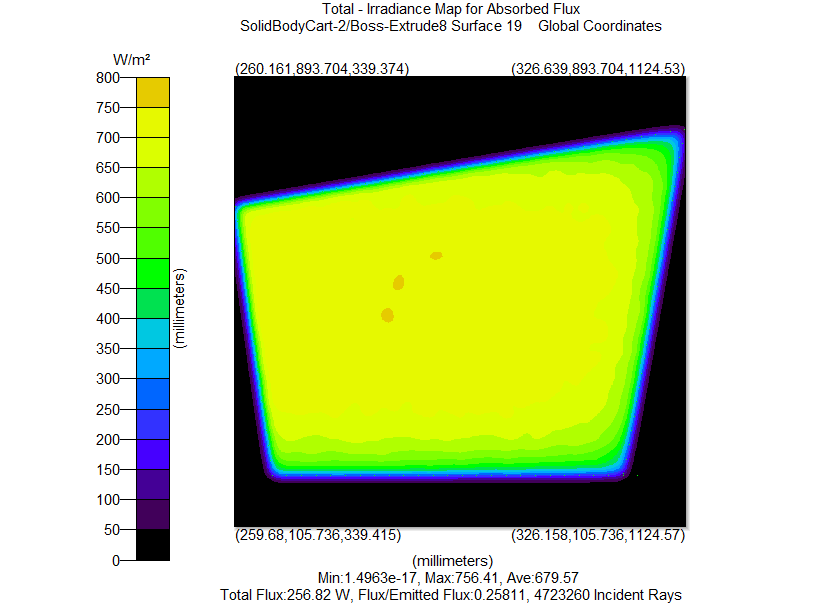
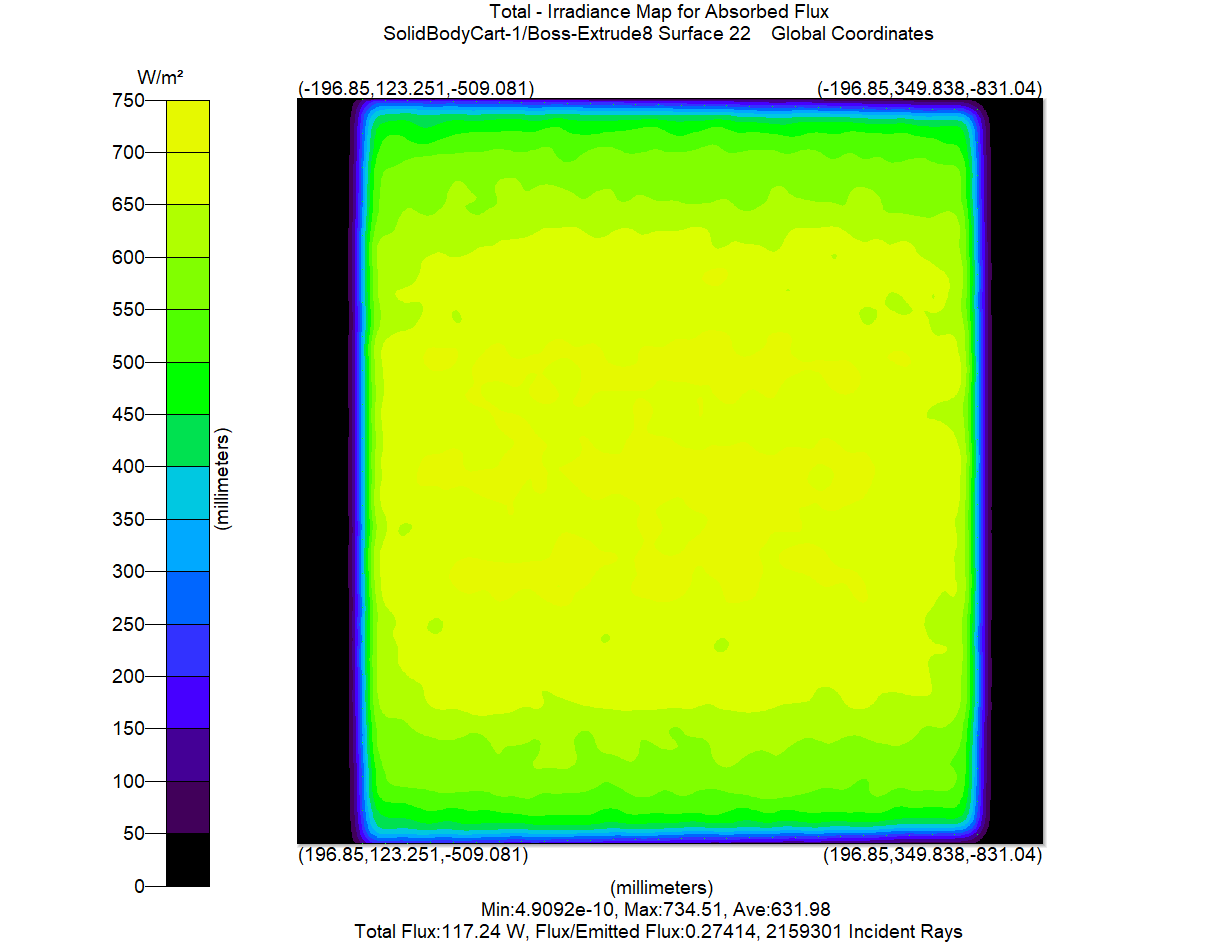
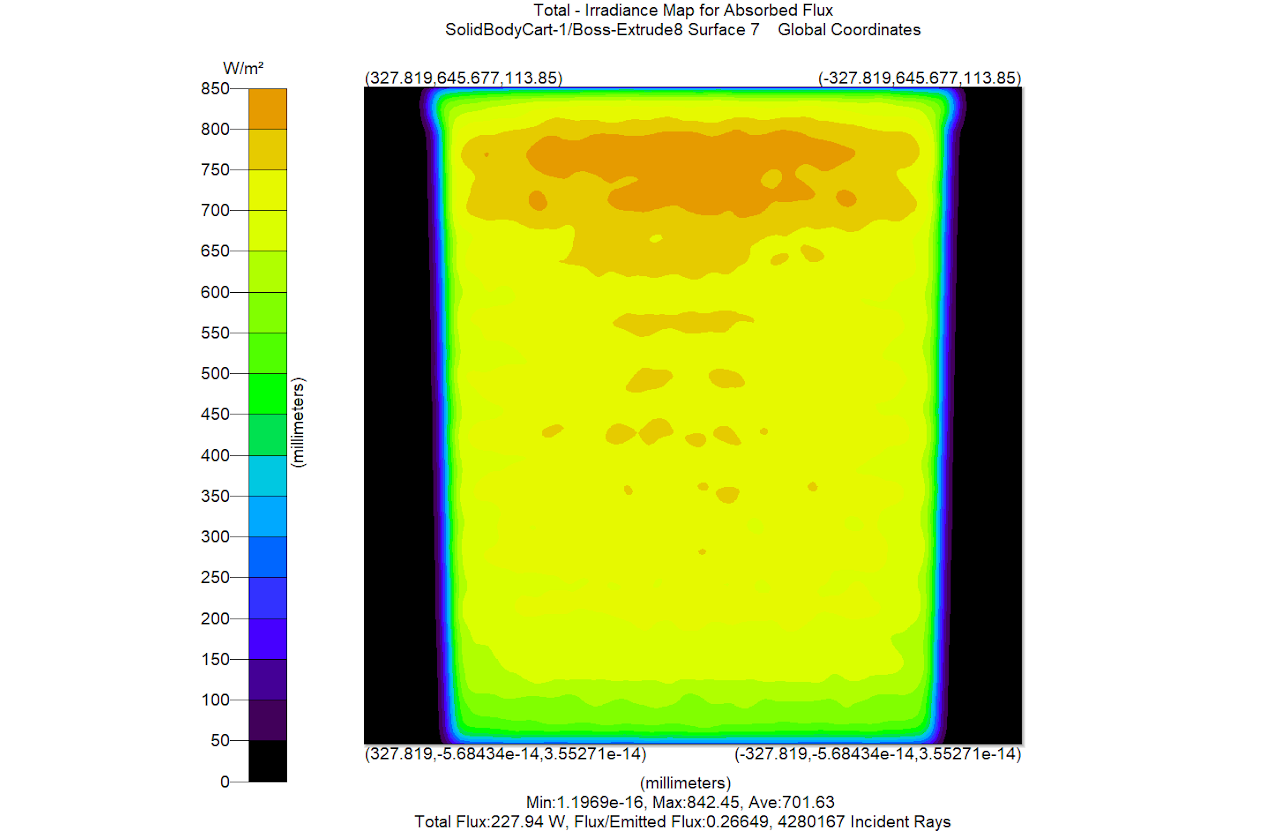
Inner-surface incident-fluence maps
Per-surface incident UV-C fluence after a full cycle. Hotter colours = higher dose. Handles and overhangs are the worst-case regions and drive the cycle-time choice.
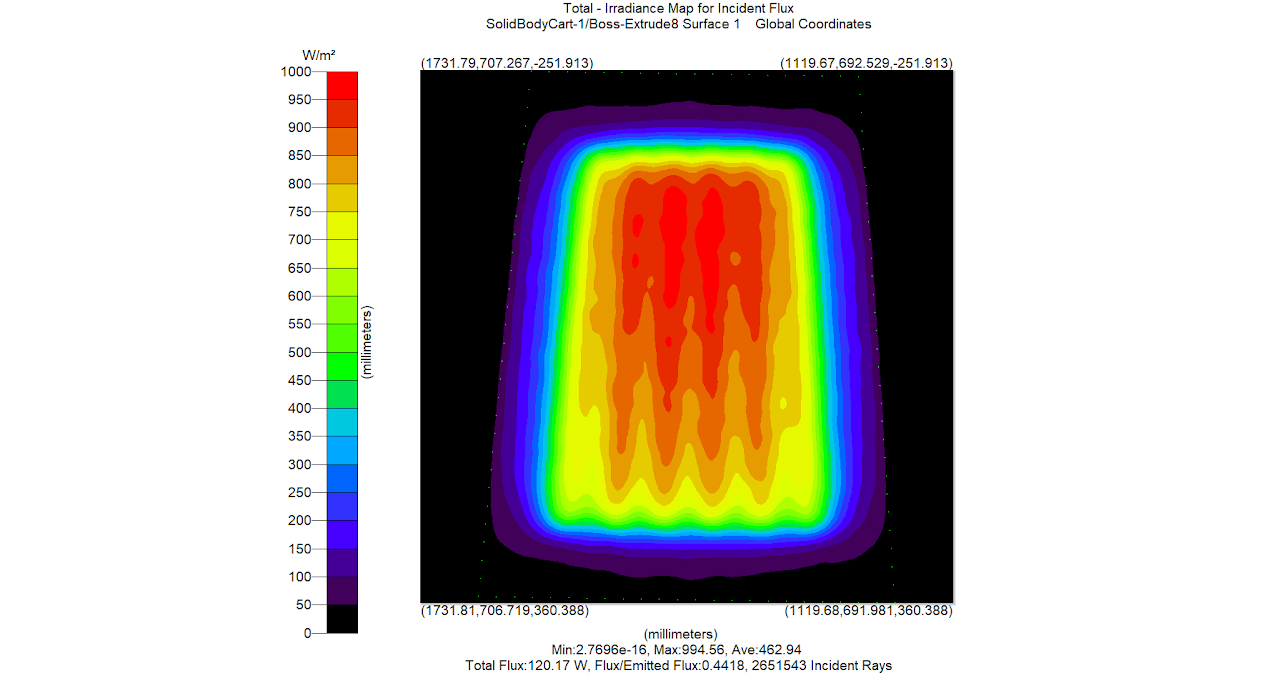
Inner bottom
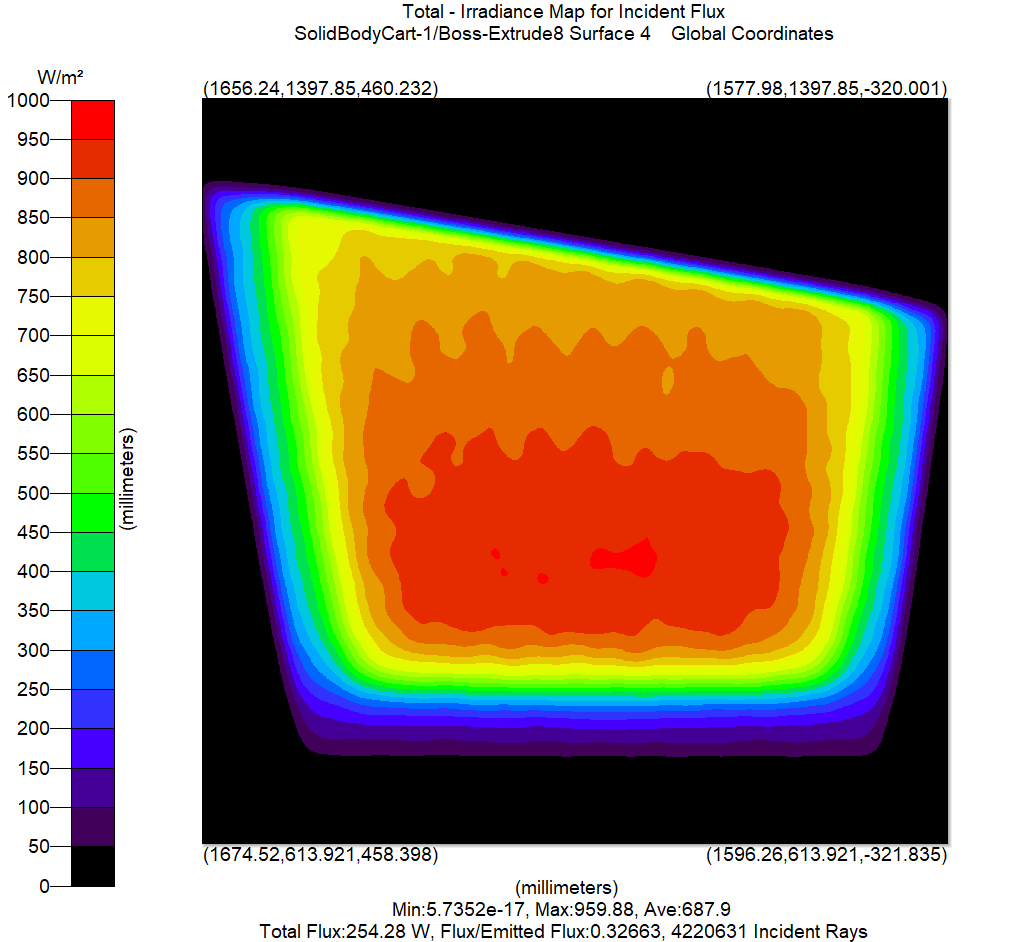
Inner side
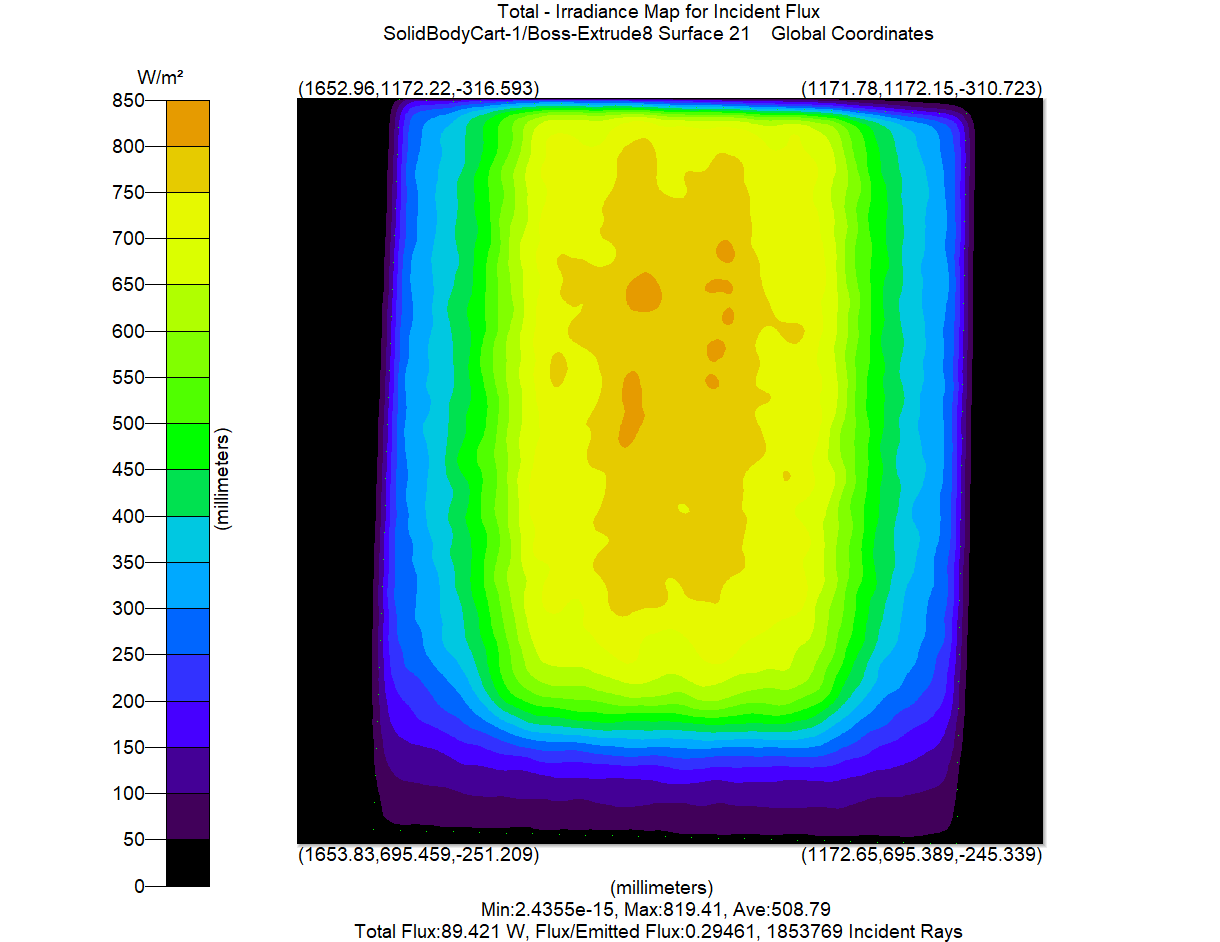
Inner front
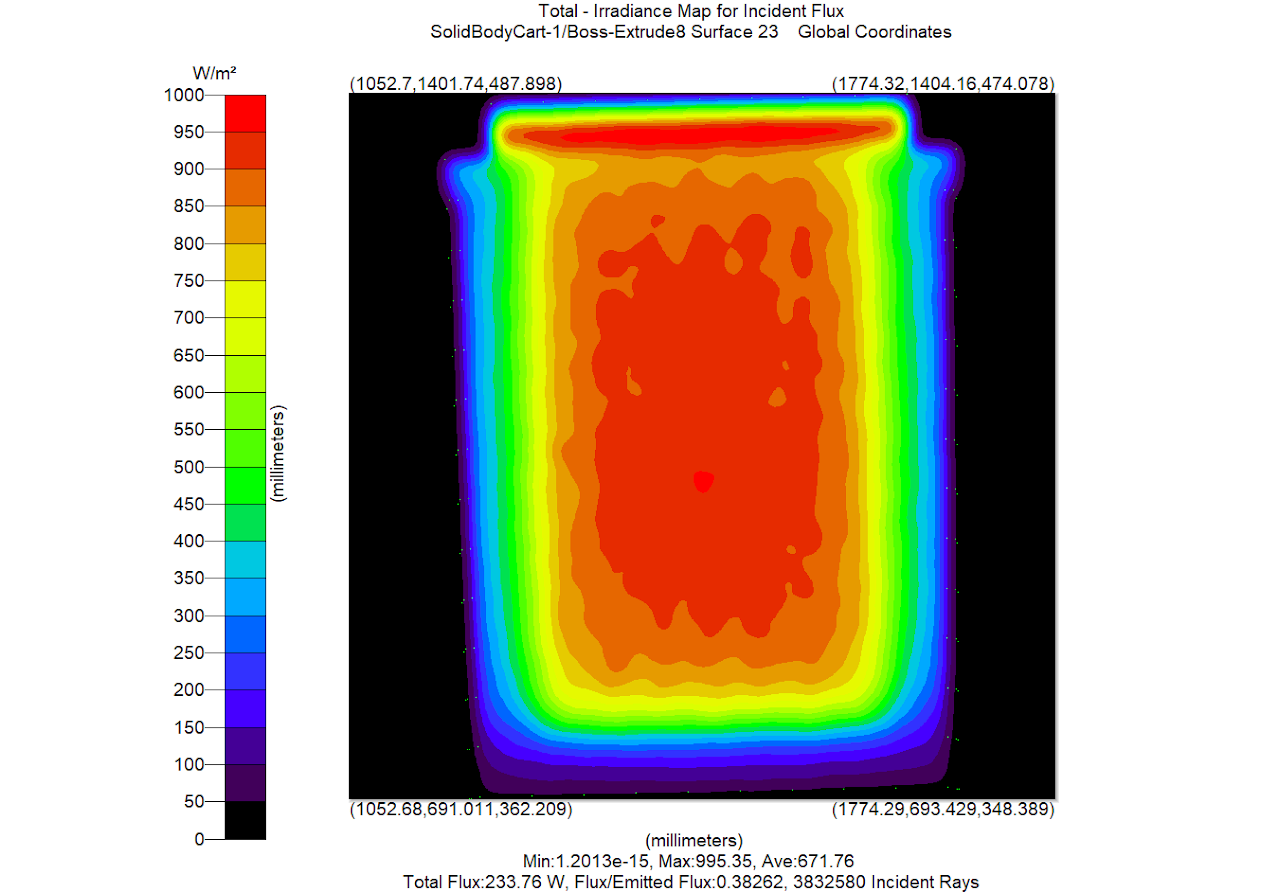
Inner rear
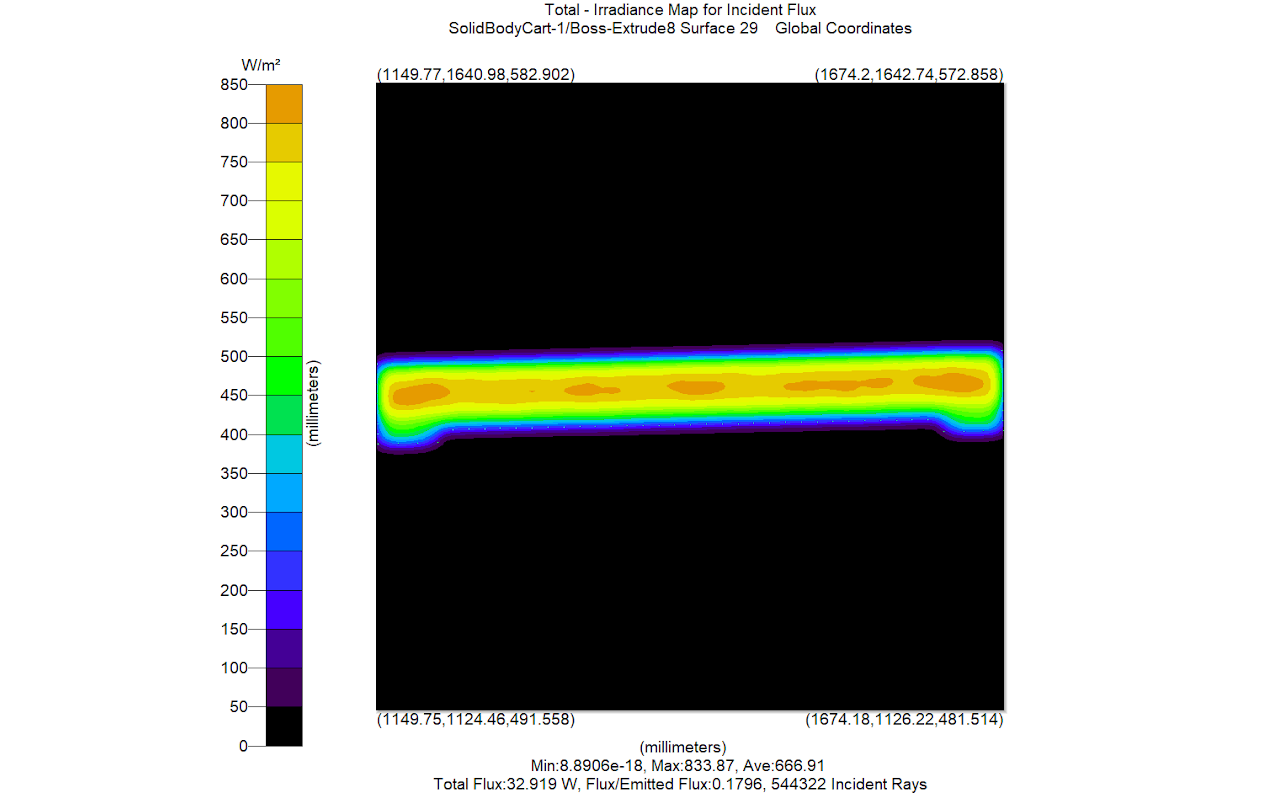
Handle (worst-case region)
Per-region absorbed-ray totals
Volumetric absorbed-ray summaries used as a sanity check on the per-surface fluence maps. The numbers in the labels are absorbed-ray totals, not dose.
4.7 M rays absorbed
Front view, 2.1 M rays

Back (small), 1.0 M rays
Back (large), 4.3 M rays
Image-Processing Validation
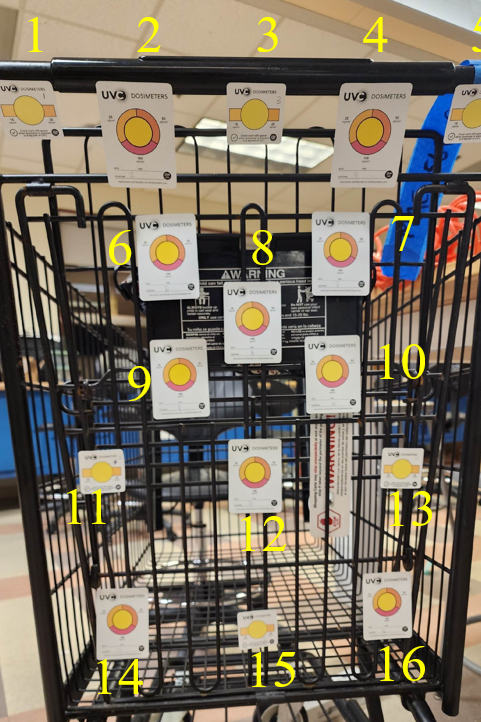
The empirical validation step uses commercial UV-C indicator strips on the contact surfaces. After a sterilisation cycle, each strip is photographed under controlled lighting; the image processing pipeline converts the colour change into a quantitative dose estimate that can be compared against the simulation prediction at the same surface point.
- Colour correction. Greycard reference in every photo to normalise white balance and exposure.
- Strip localisation. Threshold + contour analysis to isolate each indicator strip from the cart background.
- Per-strip dose estimation. Average colour inside the strip mask is mapped to UV-C dose via a calibration curve fit on a known-dose reference panel.
- Surface registration. Each strip's known location on the cart maps it back to a pixel in the simulation's surface fluence map for direct comparison.
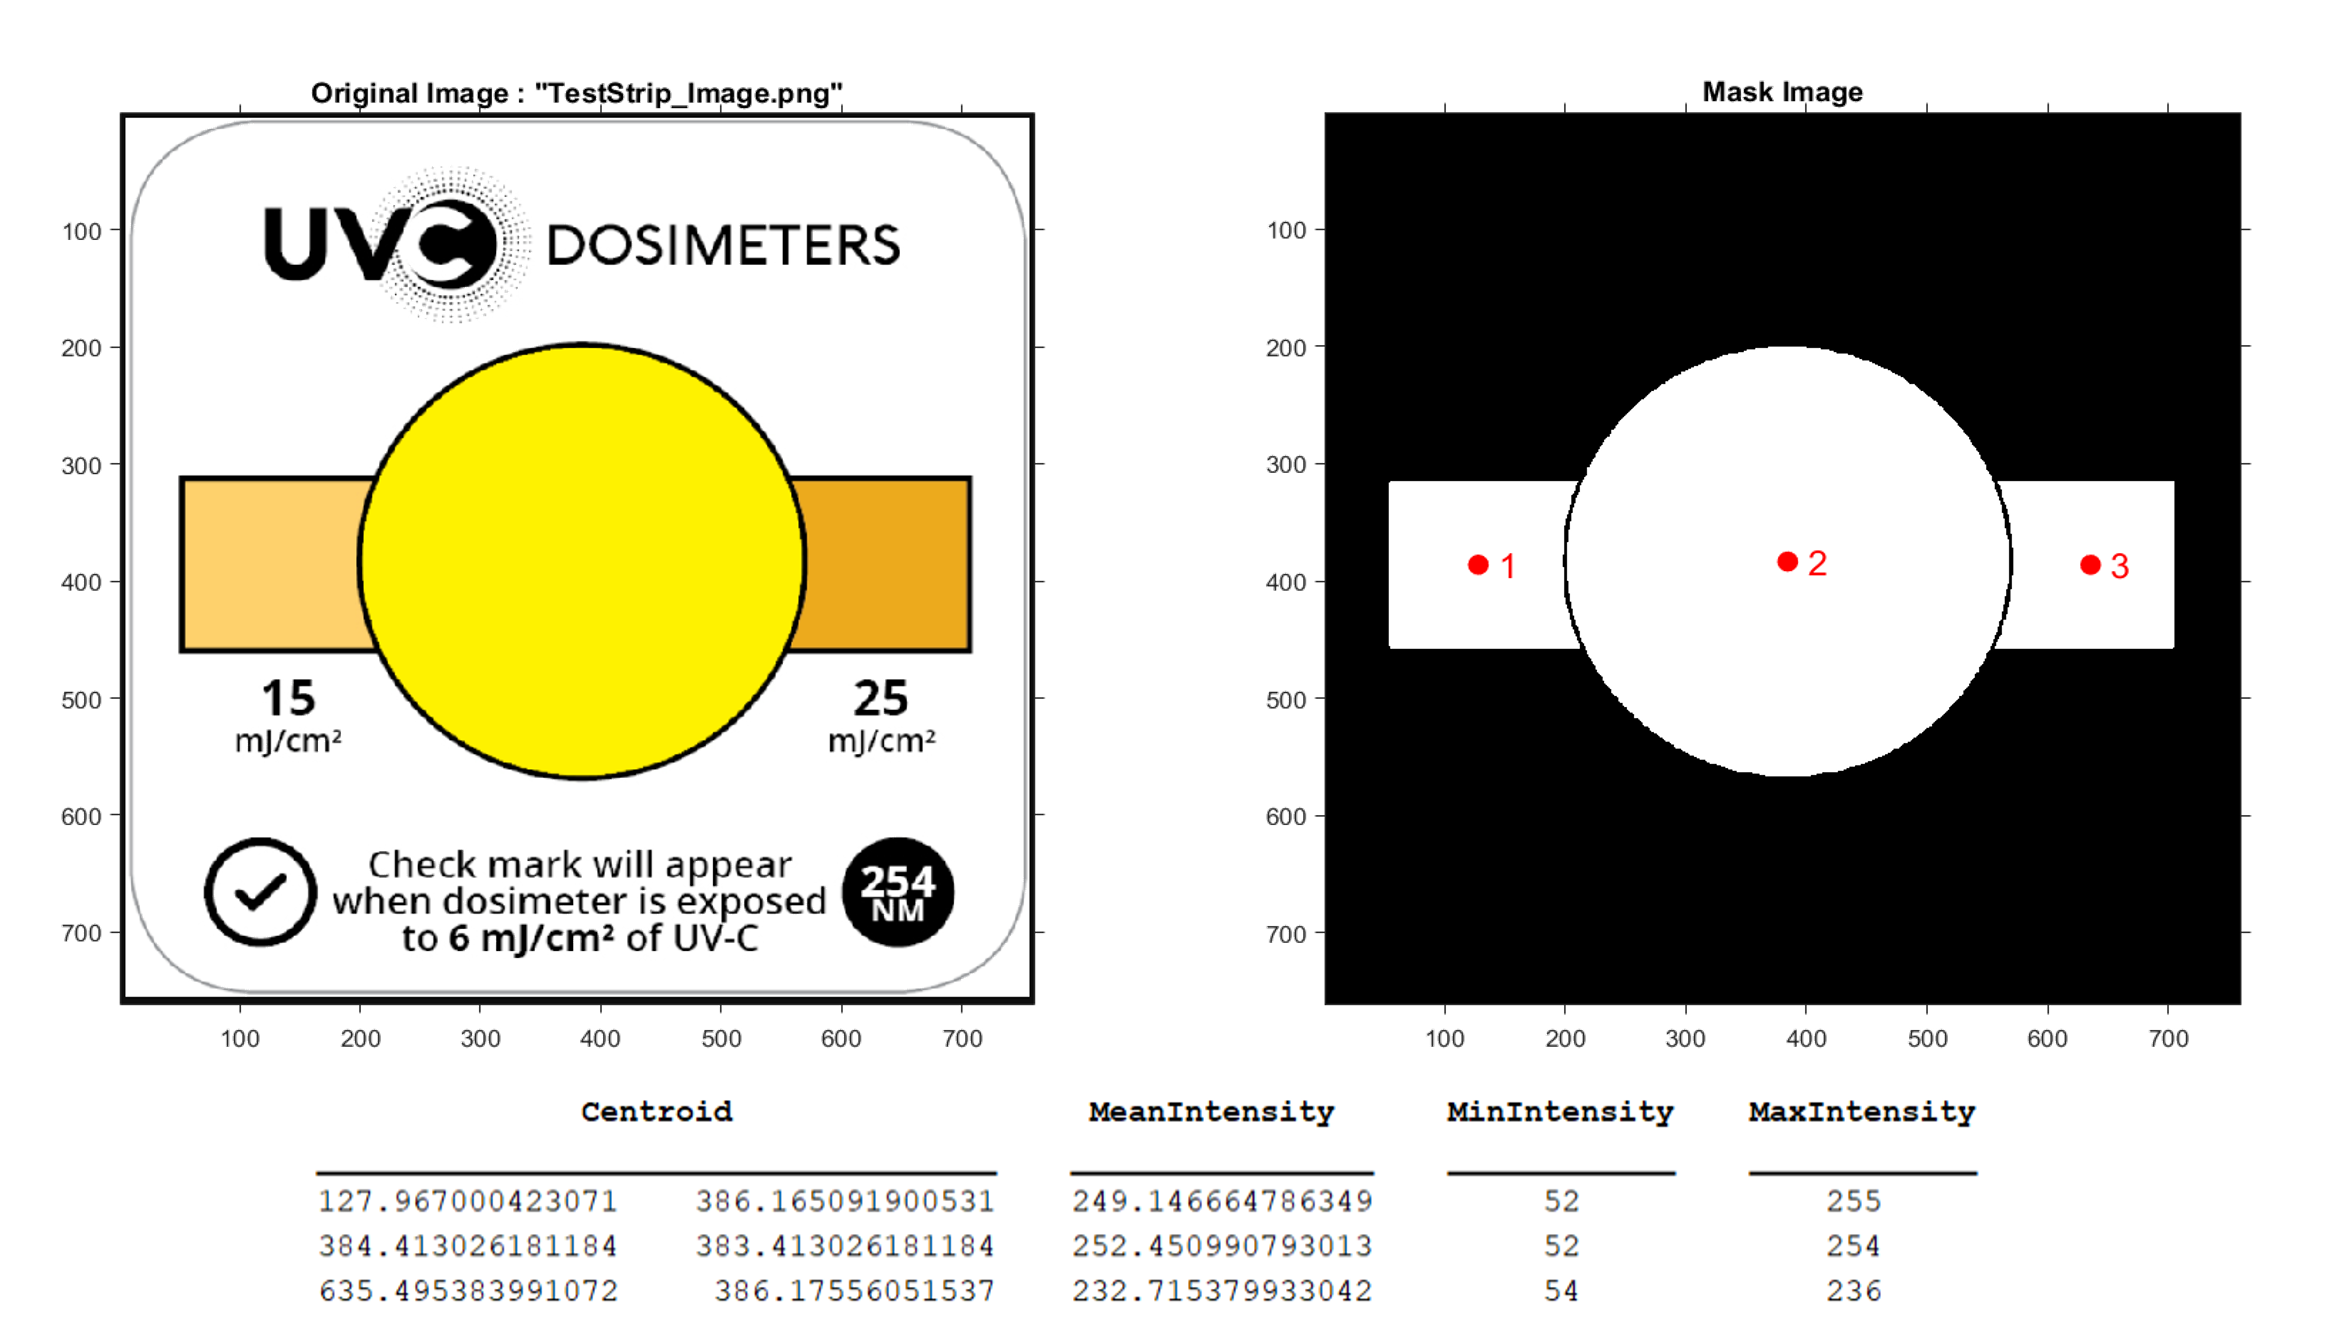
End-to-end image-processing pipeline
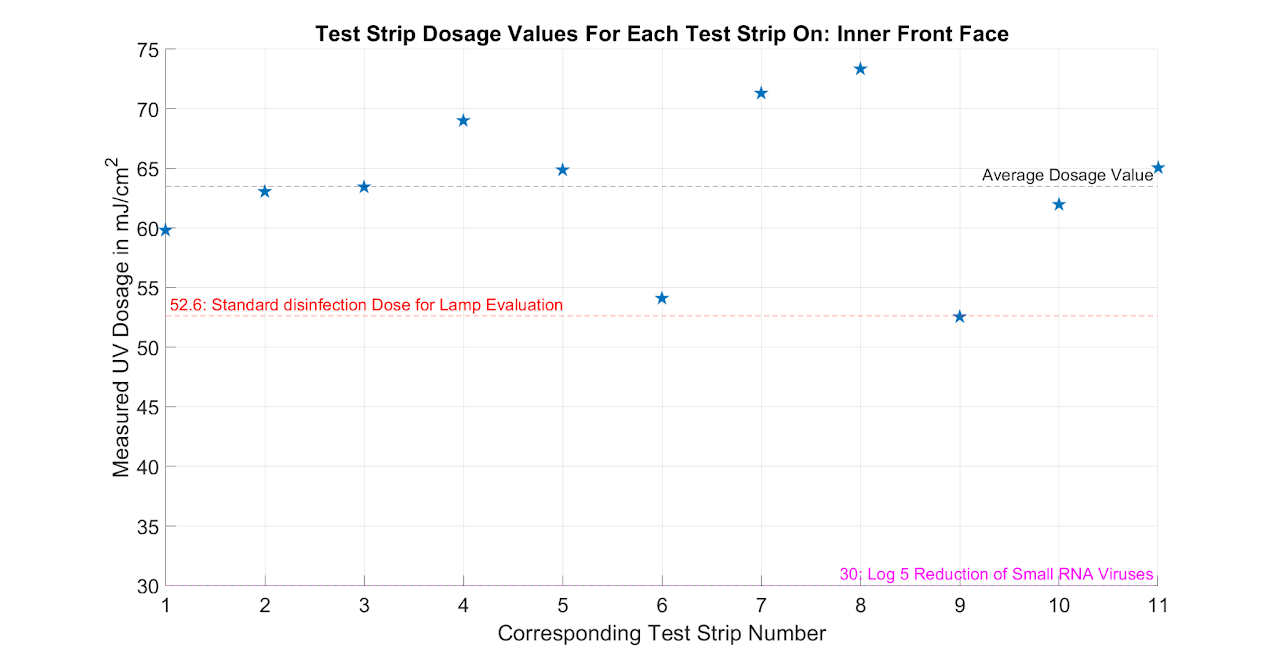
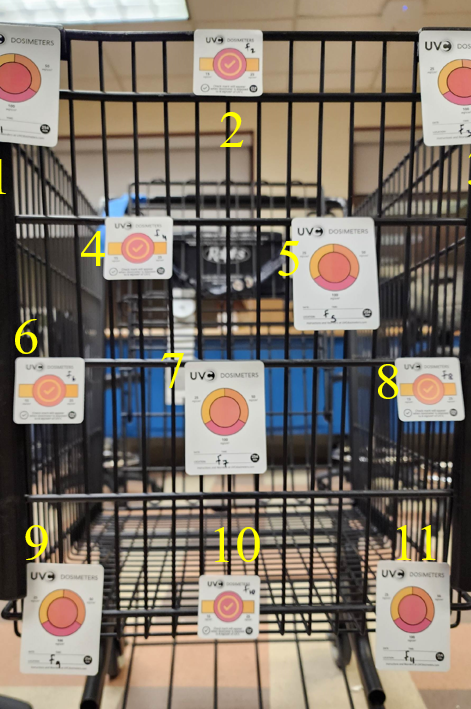
Empirical Test Strips · Front and Rear Faces
Per-trial output for two of the cart faces: the raw photograph of the indicator strips, and the corresponding dose-coded overlay produced by the pipeline. Trials were repeated across 100+ exposures to characterise variance.
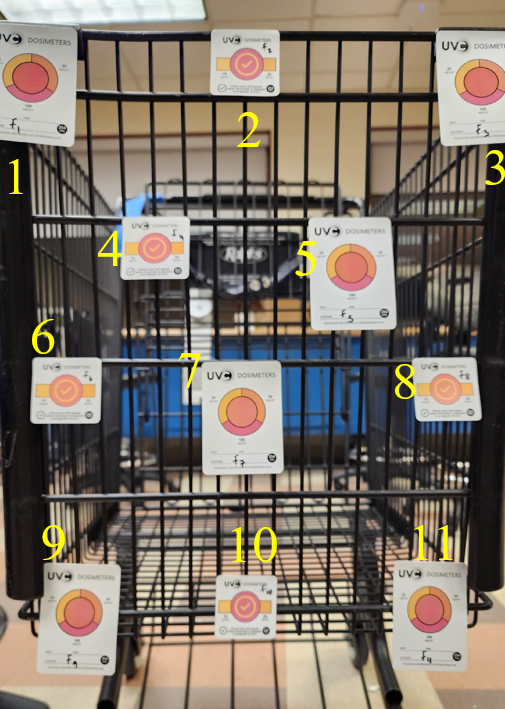
Front face inner · raw
Front face inner · dose overlay
Front face · raw
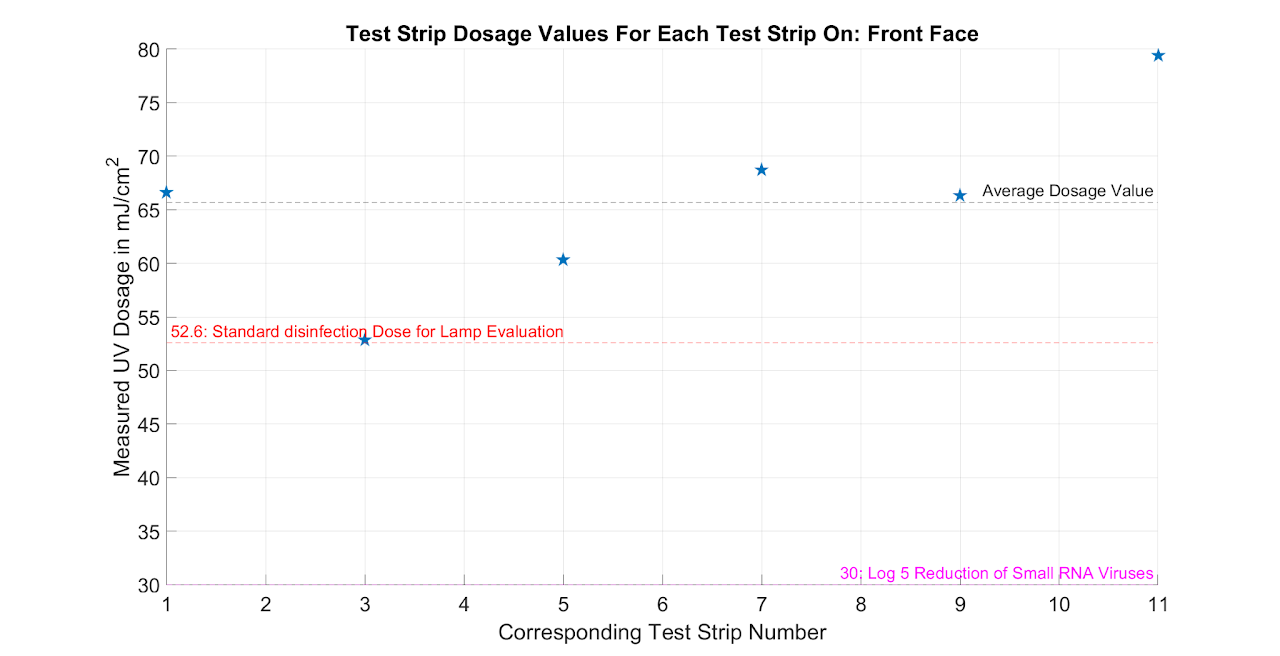
Front face · dose overlay
Rear face · raw
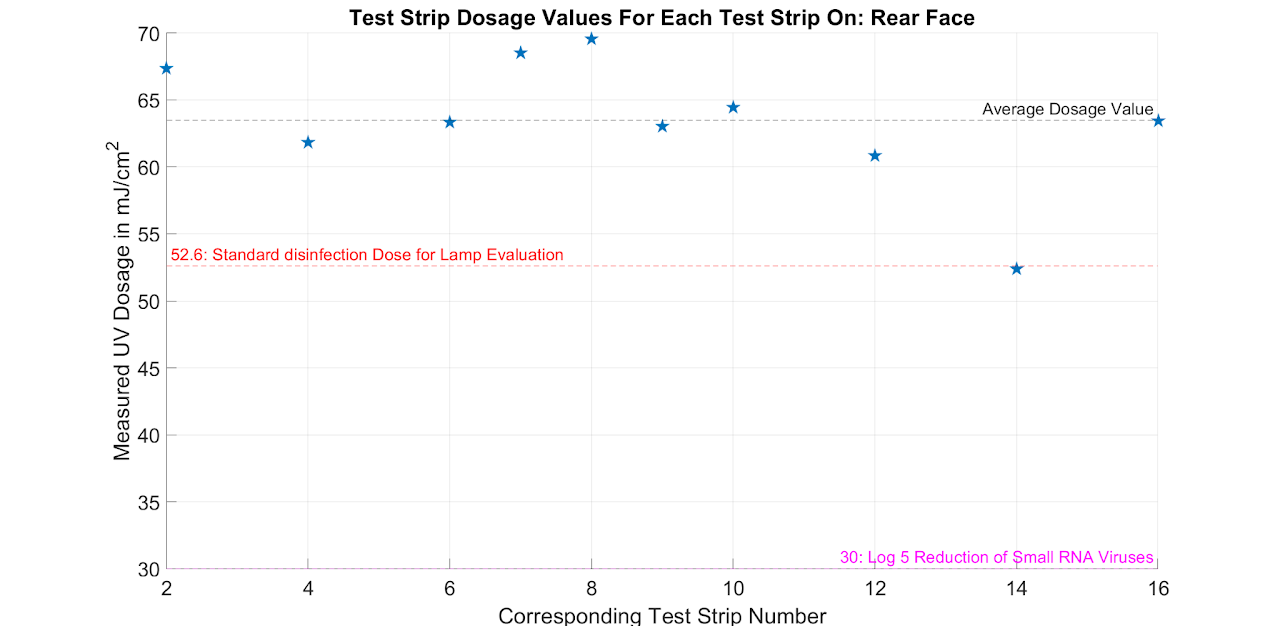
Rear face · dose overlay
Sponsored by Jeffrey Levitt and Applied UVc. Built with team-mates Nethmi Arachchi, Liam Carmody, Adam Douglas, and Aryian Schreiner. Project page: UCSD MAE 156B Team 25.