Image Reconstruction from Sparse Random Samples
Abstract
A canonical test image (Lenna, 512 × 512) is randomly sub-sampled at five rates (1 %, 2 %, 5 %, 10 %, 20 %) and reconstructed by three interpolation methods (nearest neighbour, linear, cubic) on a regular grid via scipy.interpolate.griddata. Each (rate × method) combination is scored by PSNR and SSIM. Linear interpolation outperforms cubic across all rates because the random scatter does not provide enough local structure for cubic to fit polynomials cleanly.
Method
For each rate r and method m:
- Sample n = ⌊r · H · W⌋ pixel locations uniformly without replacement (seed = 42 for reproducibility).
- For each colour channel, run
griddata(coords, values, (grid_y, grid_x), method=m)to interpolate to a full-resolution grid. Out-of-hull NaNs (a corner case for cubic) are filled with the nearest-neighbour fallback. - Score the reconstructed image against the ground truth: PSNR with
data_range = 255, SSIM in colour mode.
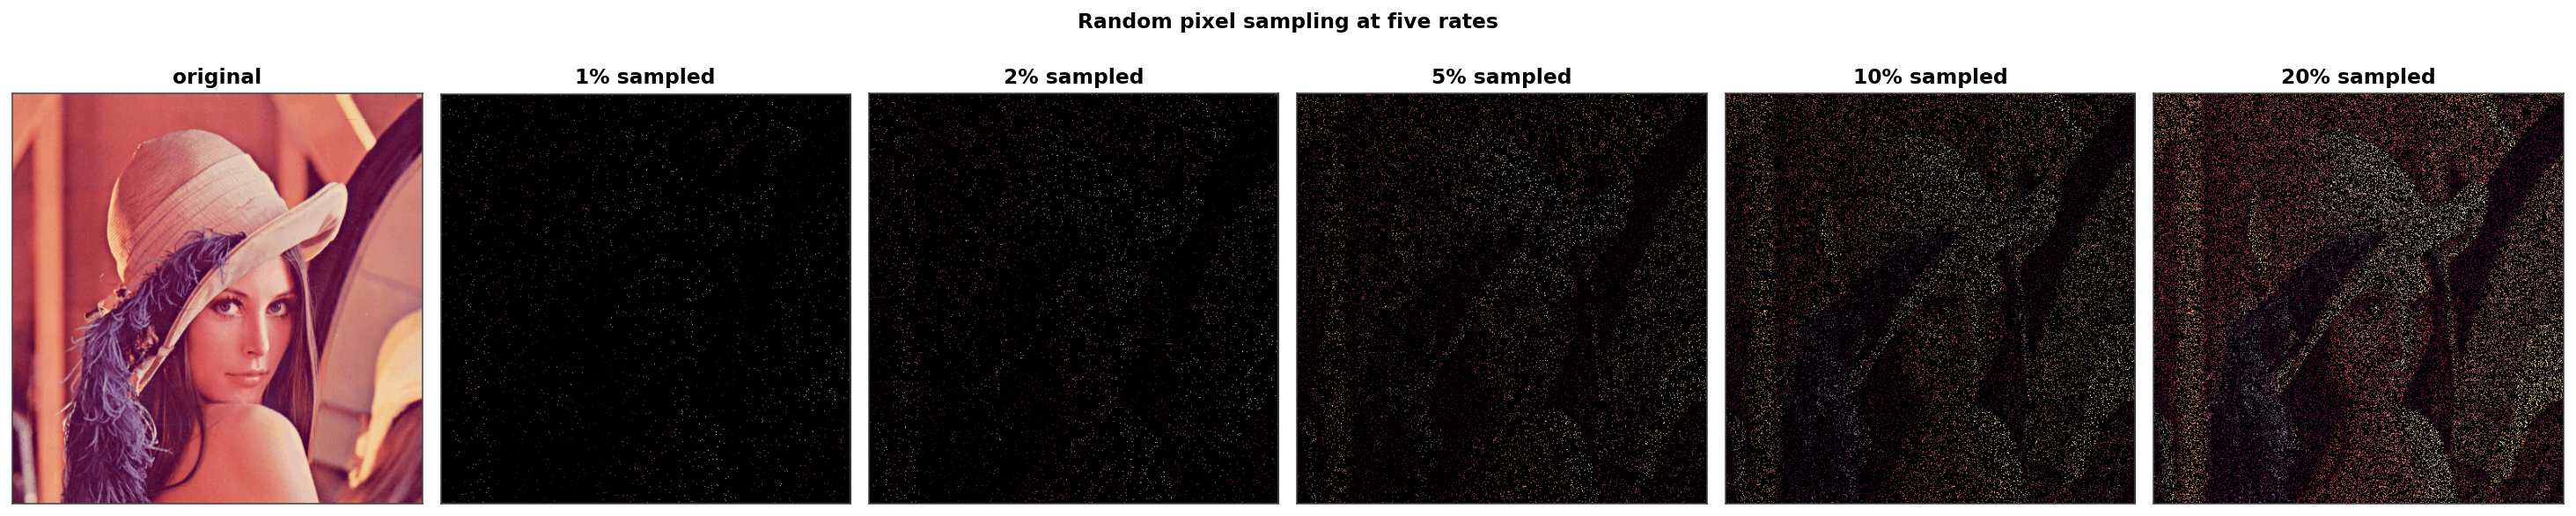
Sampling Patterns
Original image alongside the five sampled-only views. Black pixels are the unsampled majority; coloured pixels are the retained samples.
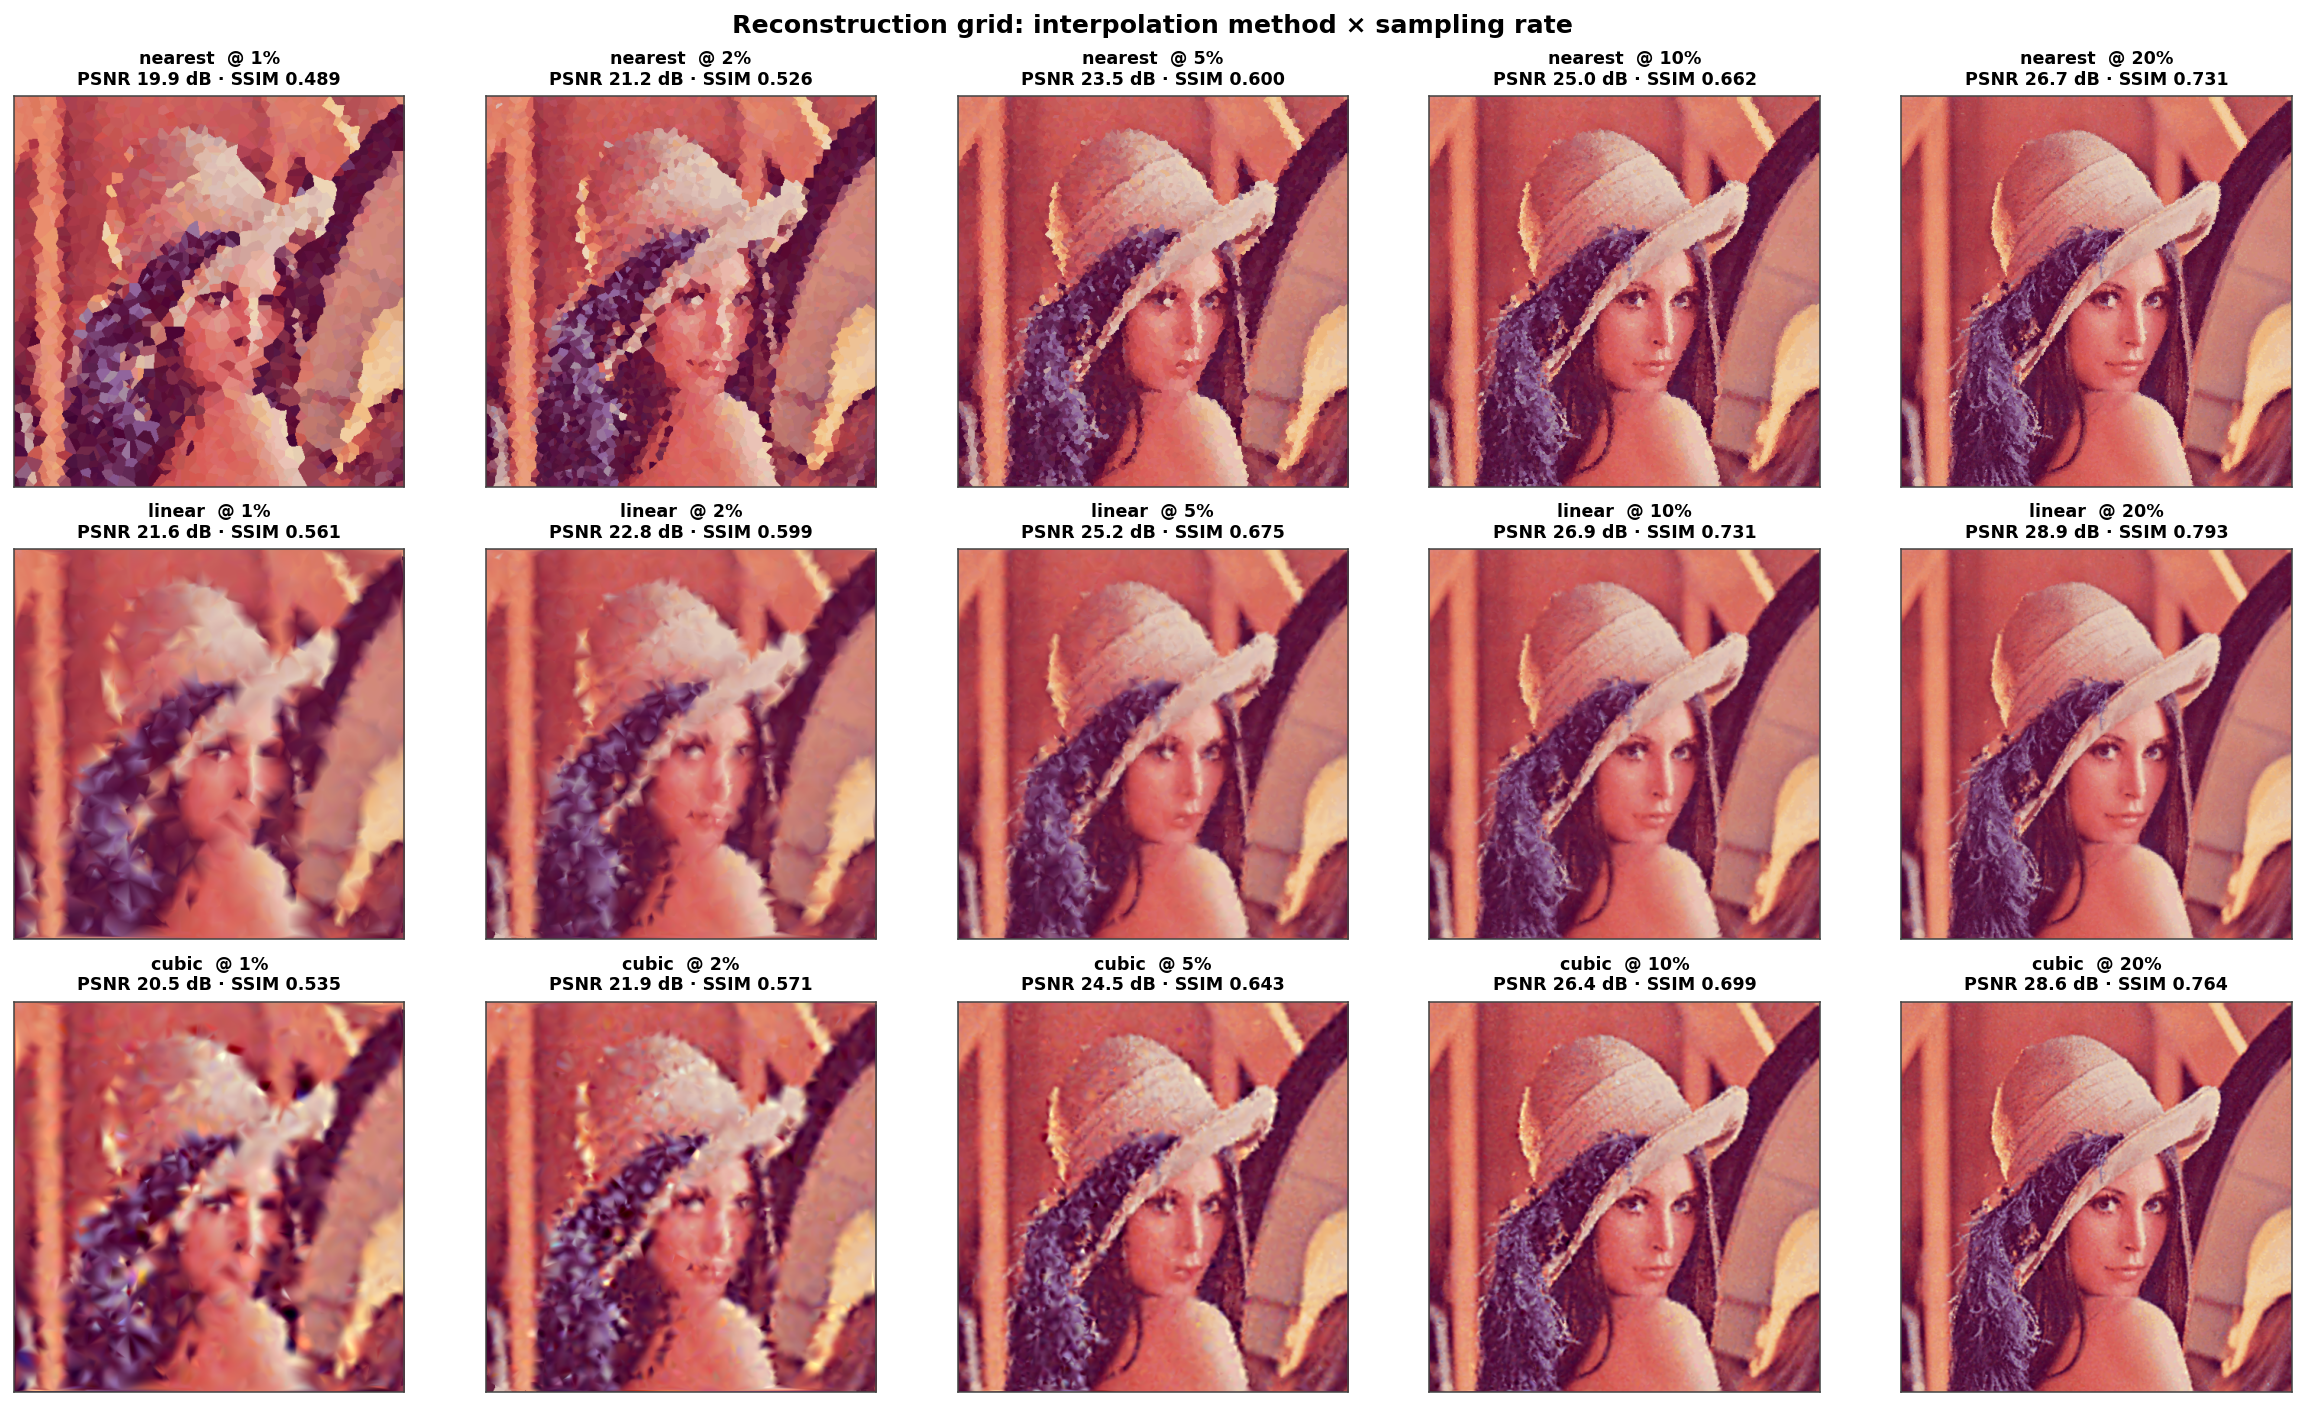
Reconstruction Grid (Method × Rate)
15 reconstructions, one per (method × rate) cell. Per-panel PSNR and SSIM are annotated on each title.
Headline Numbers
| Rate | Method | PSNR (dB) | SSIM |
|---|---|---|---|
| 1 % | nearest | 19.95 | 0.489 |
| 1 % | linear | 21.57 | 0.561 |
| 1 % | cubic | 20.49 | 0.535 |
| 5 % | nearest | 23.45 | 0.600 |
| 5 % | linear | 25.21 | 0.675 |
| 5 % | cubic | 24.45 | 0.643 |
| 10 % | nearest | 24.98 | 0.662 |
| 10 % | linear | 26.87 | 0.731 |
| 10 % | cubic | 26.36 | 0.699 |
| 20 % | nearest | 26.74 | 0.731 |
| 20 % | linear | 28.88 | 0.793 |
| 20 % | cubic | 28.55 | 0.764 |
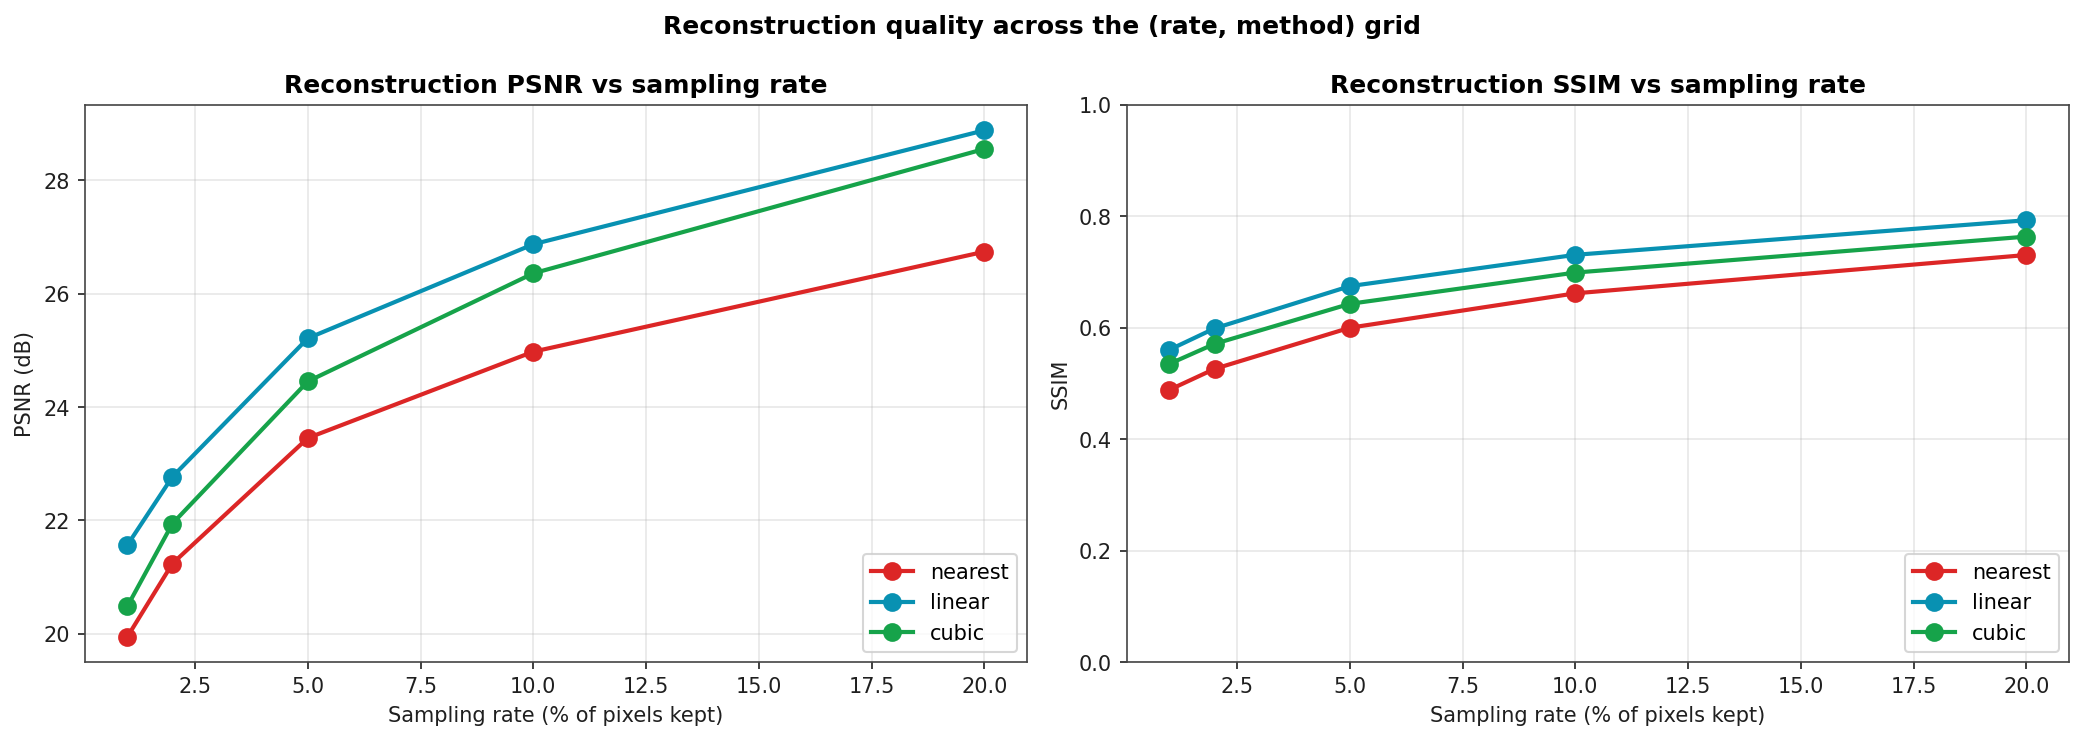
PSNR and SSIM vs Sampling Rate
Both metrics scale roughly logarithmically with the sampling rate. The gap between linear and nearest is consistent at about 1.5 dB across all rates. Cubic should in principle outperform linear when the signal is smooth and the samples are dense; on this image (real photograph with edges) and at these sampling rates (very sparse), cubic over-smooths near edges and under-fits the high-frequency texture in skin and hair.