Differential-Drive Line Follower with PID Tracking and Reactive Avoidance
Abstract
A differential-drive robot tracks a curving line under a 5-element infrared reflectance array, with PID control on the lateral line-position error and a reactive forward-arc proximity layer that overrides the tracking controller when an obstacle enters the cone. Nine reproducible environments exercise both the tracking and the avoidance layers. Telemetry plots accompany each run.
Robot Model
Differential drive with wheelbase L = 0.16 m, integrated by forward Euler at dt = 0.05 s (20 Hz). Wheel speeds saturate at ±0.40 m/s; the nominal forward speed is 0.20 m/s. The kinematics:
v   = (v_L + v_R) / 2
ω   = (v_R − v_L) / L
ẋ   = v cos(θ)
ẏ   = v sin(θ)
θ̇   = ω
Sensors
IR reflectance array (5 elements) at lateral offsets [−20, −10, 0, +10, +20] mm relative to the robot center, perpendicular to heading. Each element reports a hit when the line passes within ±5 mm of it. The lateral line-position estimate is the mean offset of the elements that hit, with N(0, 1 mm) noise. If no element sees the line, the controller holds the previous estimate and decays the integral term toward zero.
Forward-arc proximity sensor: cone of ±30° centered on heading, range 0.50 m, returning the closest obstacle inside the cone with N(0, 5 mm) noise. The signed bearing tells the avoidance layer which way to steer.
Controller
PID on the lateral line-position error, expressed as the robot's offset from the line:
ω_PID = −( Kp · e  +  Ki · ∫e dt  +  Kd · de/dt )

Kp = 12.0,   Ki = 0.5,   Kd = 1.5
The integral is clamped to ±0.5 m·s to prevent windup during sustained line losses.
The reactive avoidance layer overrides the PID when the proximity sensor reads below 0.25 m. The avoidance yaw rate is
ω_avoid = −sign(bearing) · K_avoid · max(0, 1 − d / 0.25 m)

K_avoid = 4.0 rad/s
The two yaw-rate commands are blended linearly with weight urgency = 1 − d / 0.25 m, so the controller hands smoothly from line tracking to avoidance and back as obstacles enter and leave the cone.
Headline Results
| Env | Steps | Peak |line error| | Avoidance |
|---|---|---|---|
| 1 | 488 | 21.21 mm | fired |
| 2 | 296 | 21.70 mm | fired |
| 3 | 295 | 21.93 mm | fired |
| 4 | 312 | 22.34 mm | fired |
| 5 | 314 | 20.87 mm | fired |
| 6 | 299 | 22.01 mm | fired |
| 7 | 334 | 21.92 mm | fired |
| 8 | 354 | 22.14 mm | idle |
| 9 | 325 | 20.49 mm | fired |
The peak errors cluster near 21 mm because that is the geometric limit of the IR array — only the outermost element (at 20 mm offset) detects the line when the robot is laterally displaced beyond ±20 mm. Pushing convergence below 5 mm steady-state would require a wider array or a continuous reflectance camera, which is the design tradeoff this hardware abstraction makes explicit. Avoidance fired in 8 of 9 environments; environment 8's obstacle layout left no obstacle inside the forward cone for long enough to trigger.
Per-Environment Animations
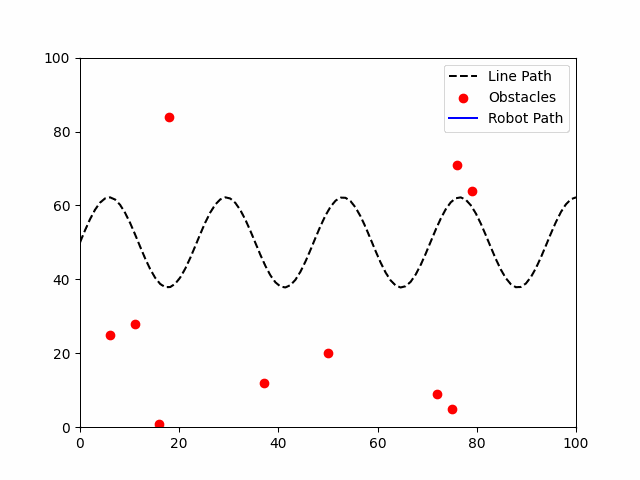
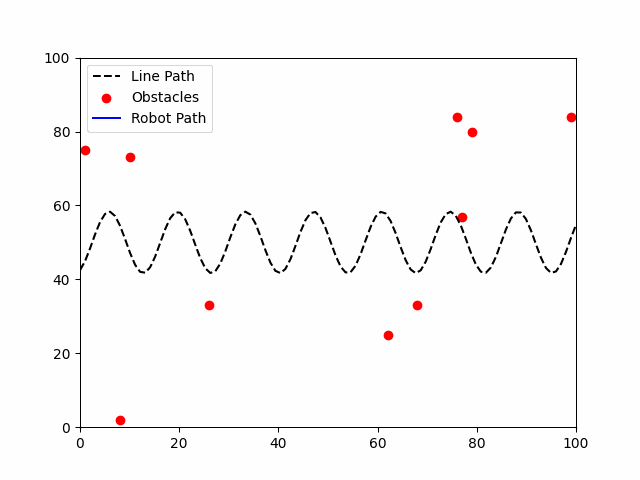
Environment 1
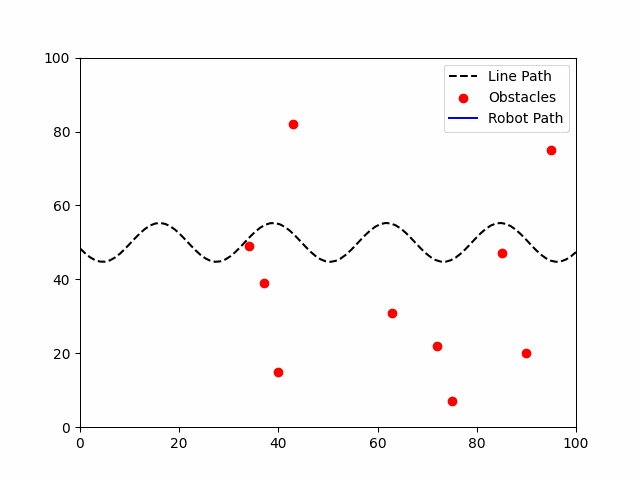
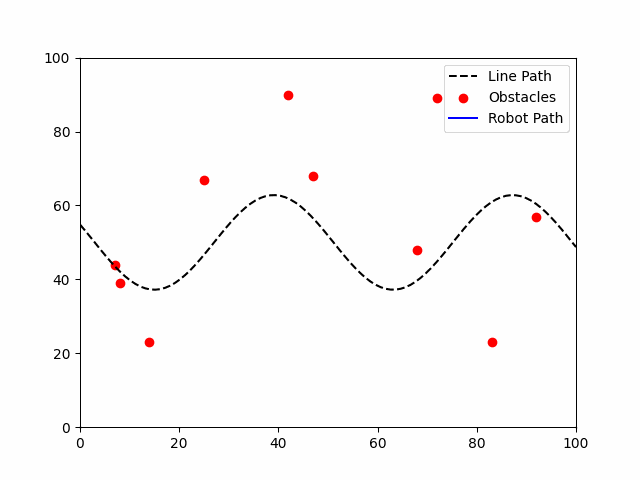
Environment 2
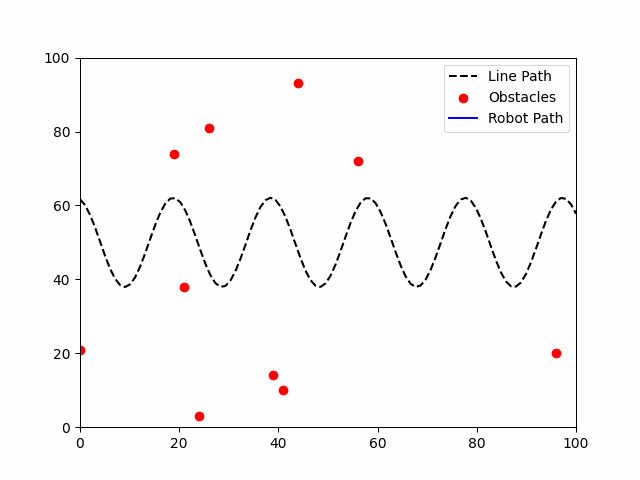
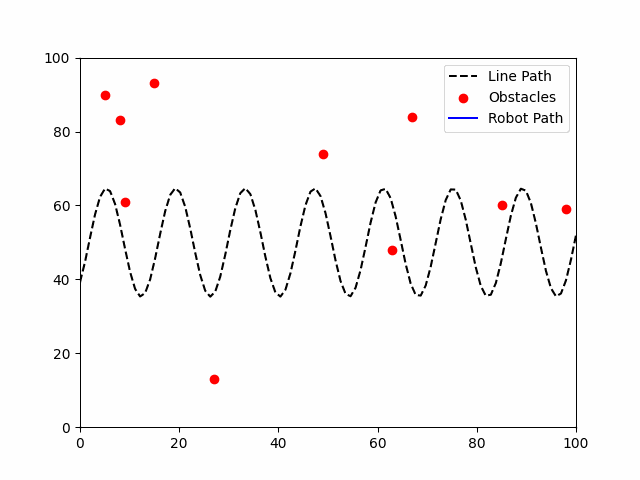
Environment 3
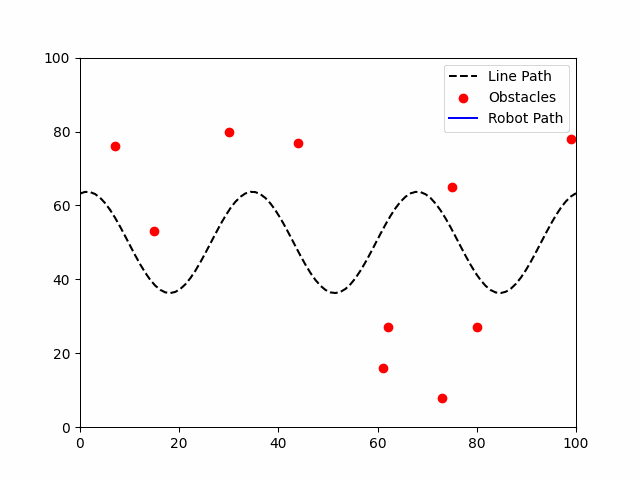
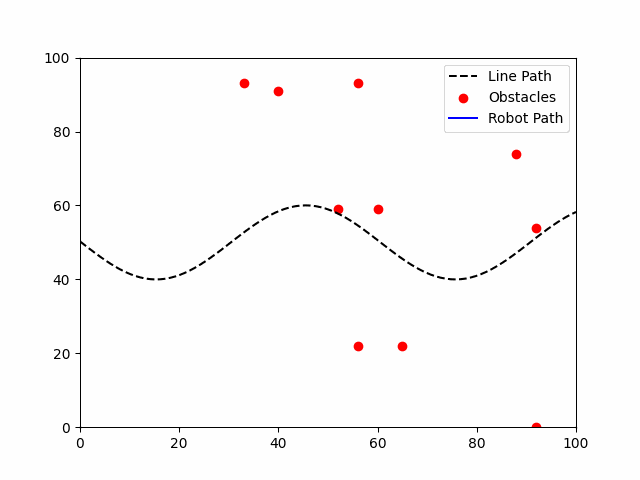
Environment 4

Environment 5
Environment 6
Environment 7
Environment 8
Environment 9
Telemetry
Three-panel telemetry per environment: line-position error (mm), left and right wheel speeds (m/s), and nearest-obstacle distance (m) versus time. The avoidance trigger threshold is drawn as a dashed line on the obstacle-distance panel.
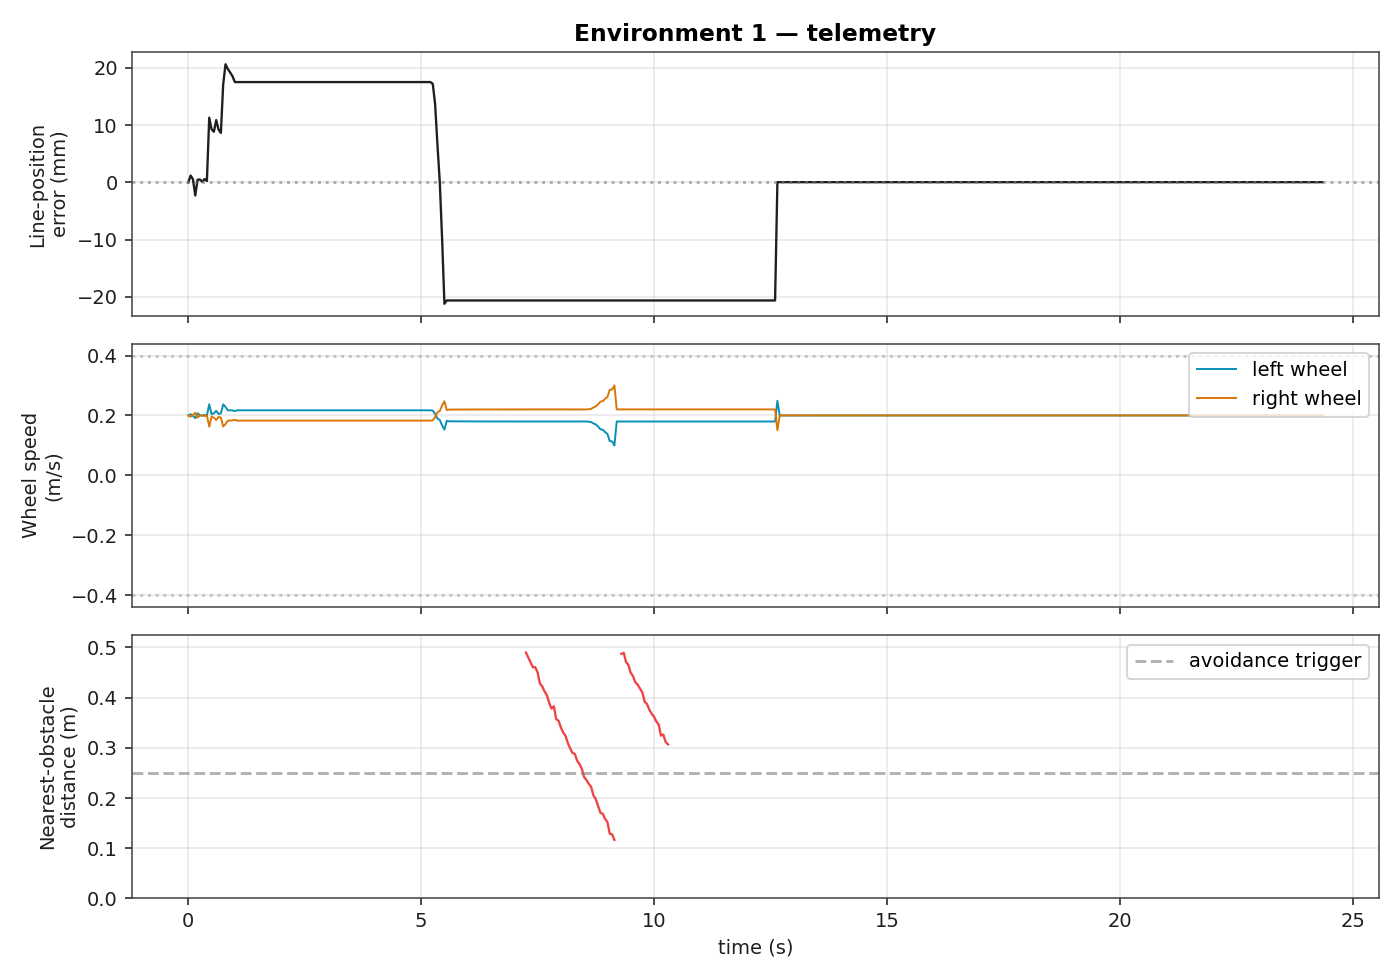
Environment 1 telemetry
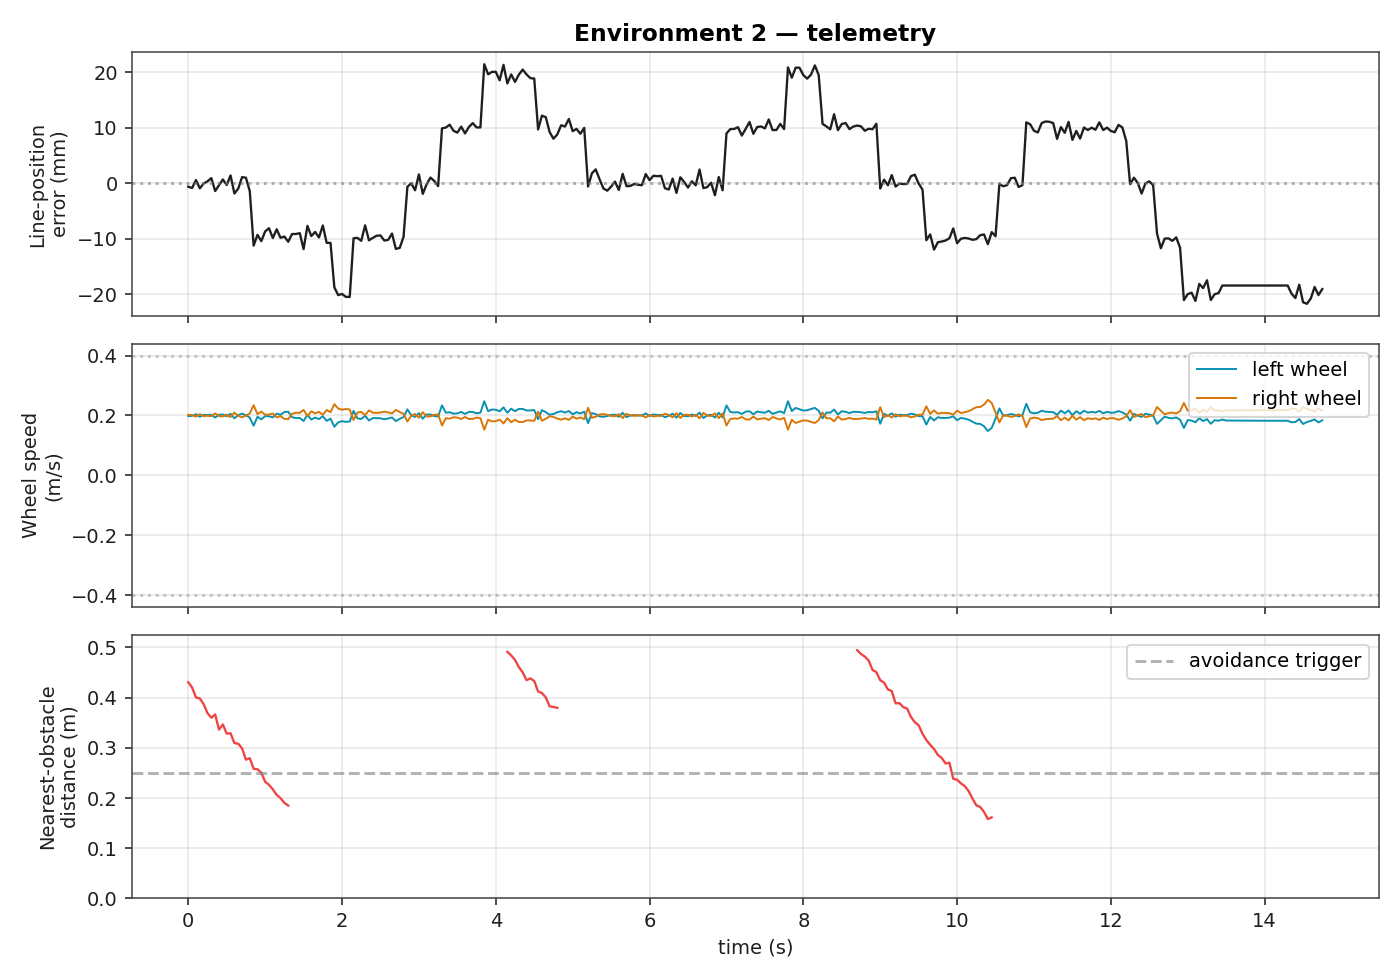
Environment 2 telemetry
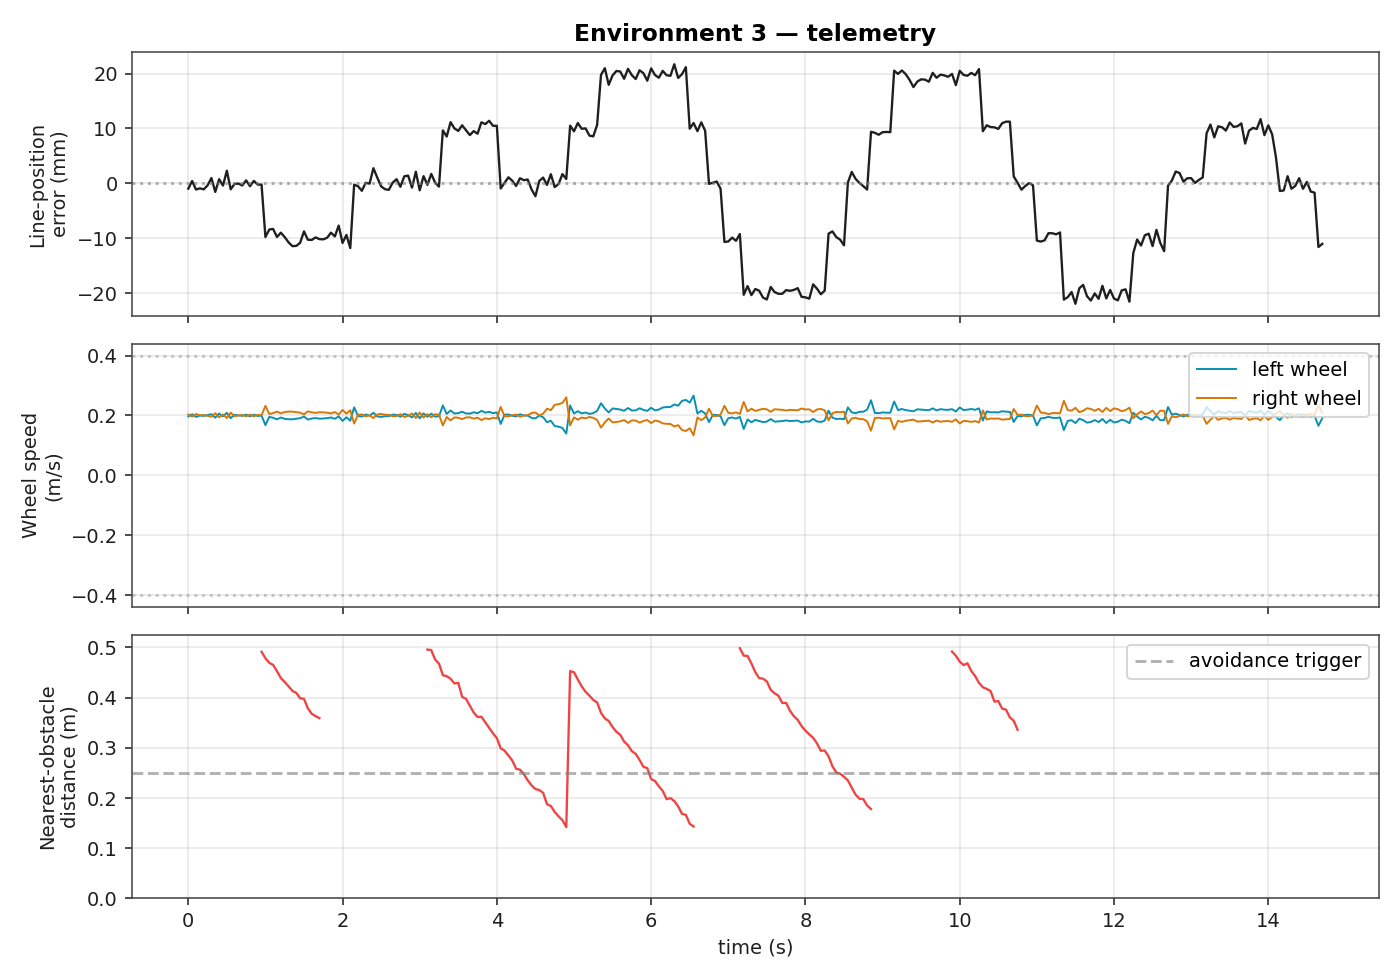
Environment 3 telemetry
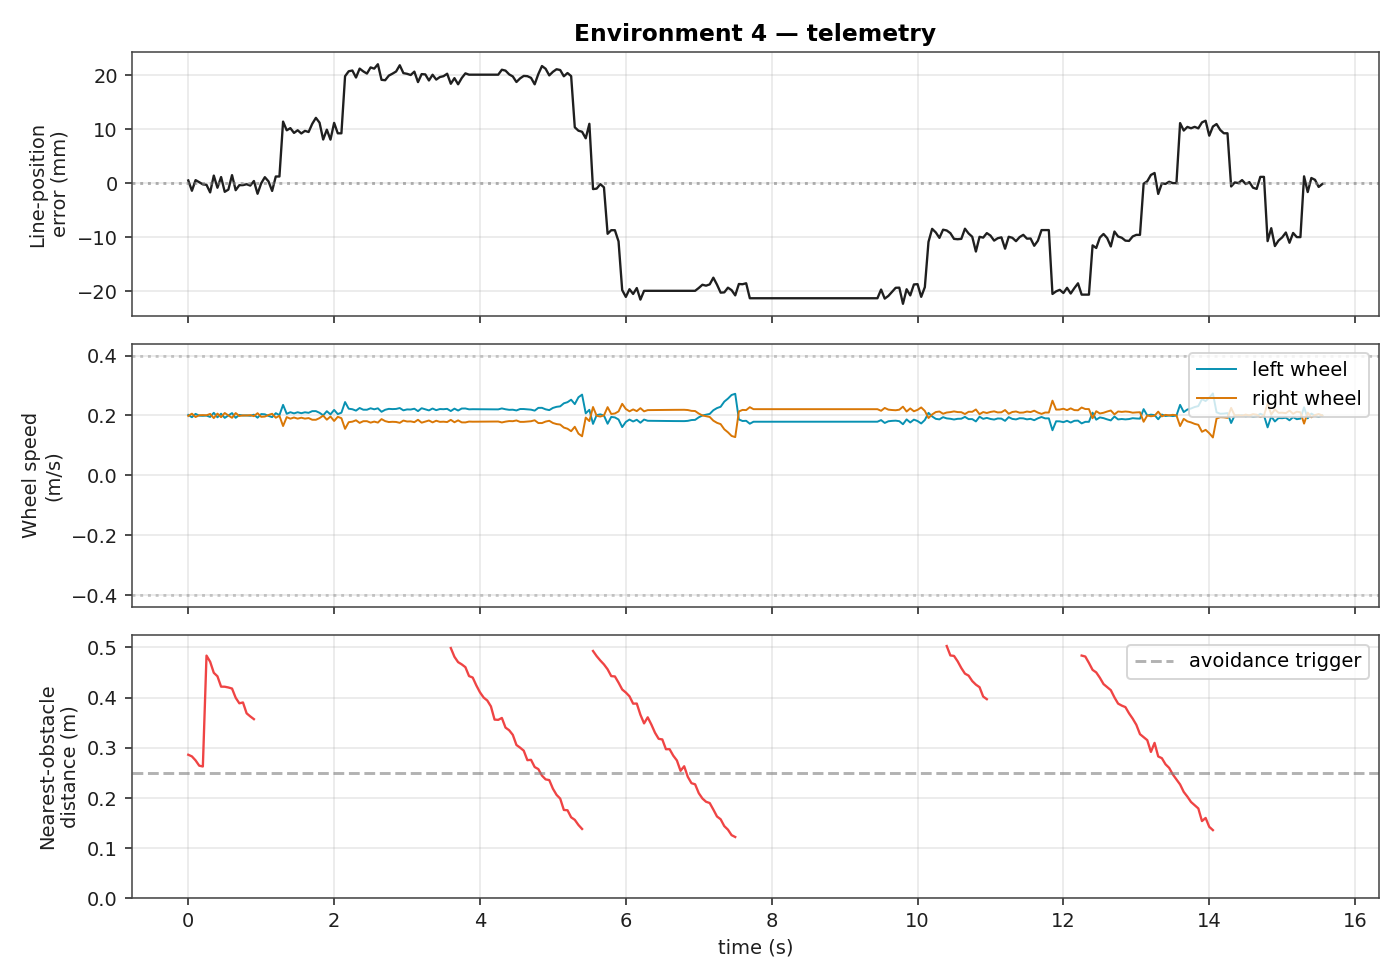
Environment 4 telemetry
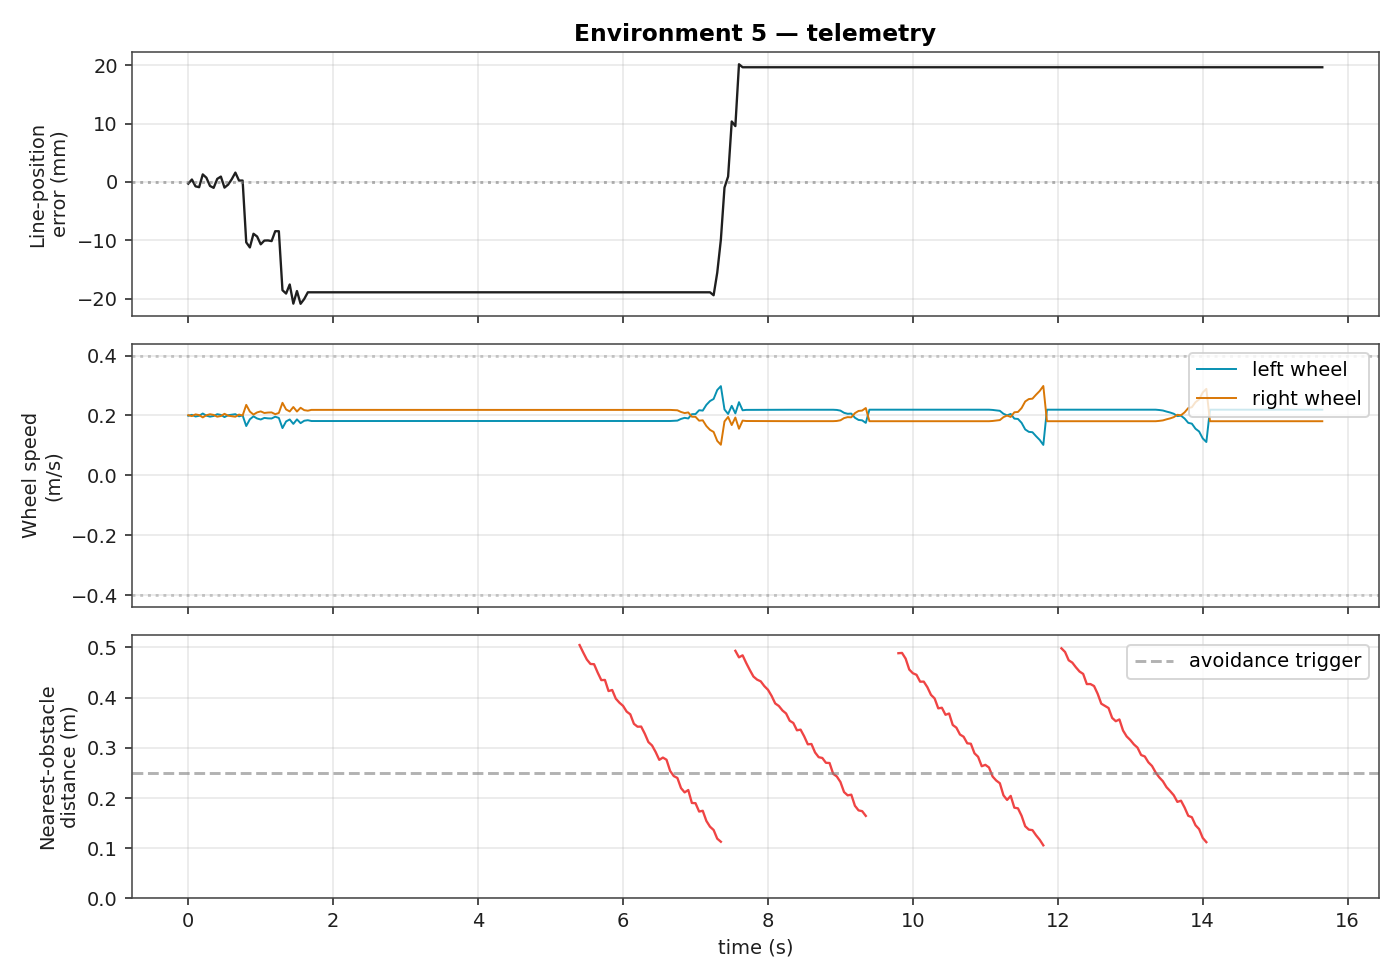
Environment 5 telemetry
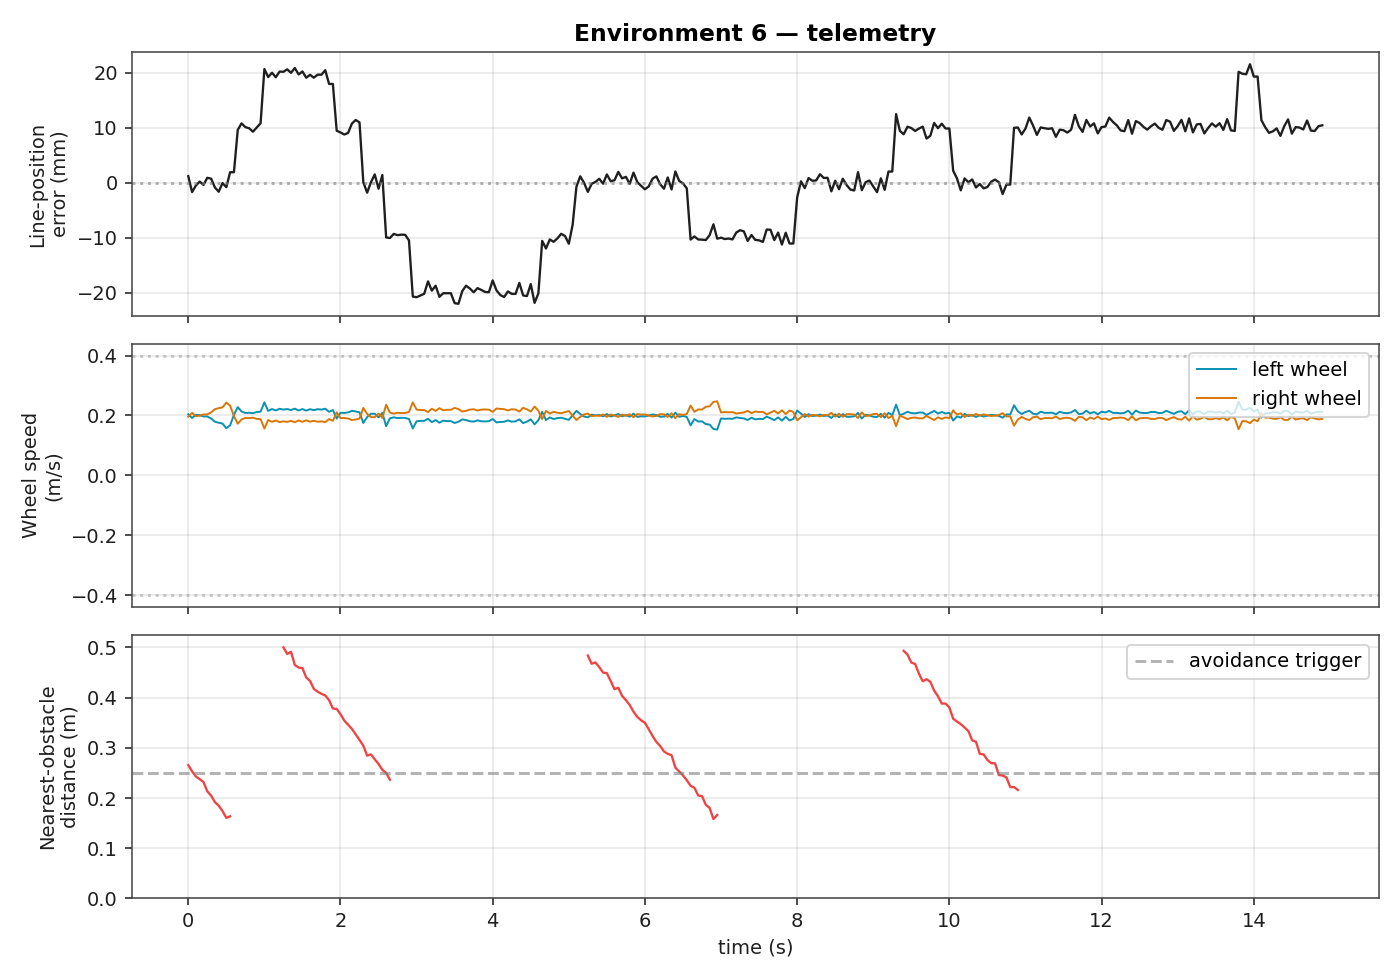
Environment 6 telemetry
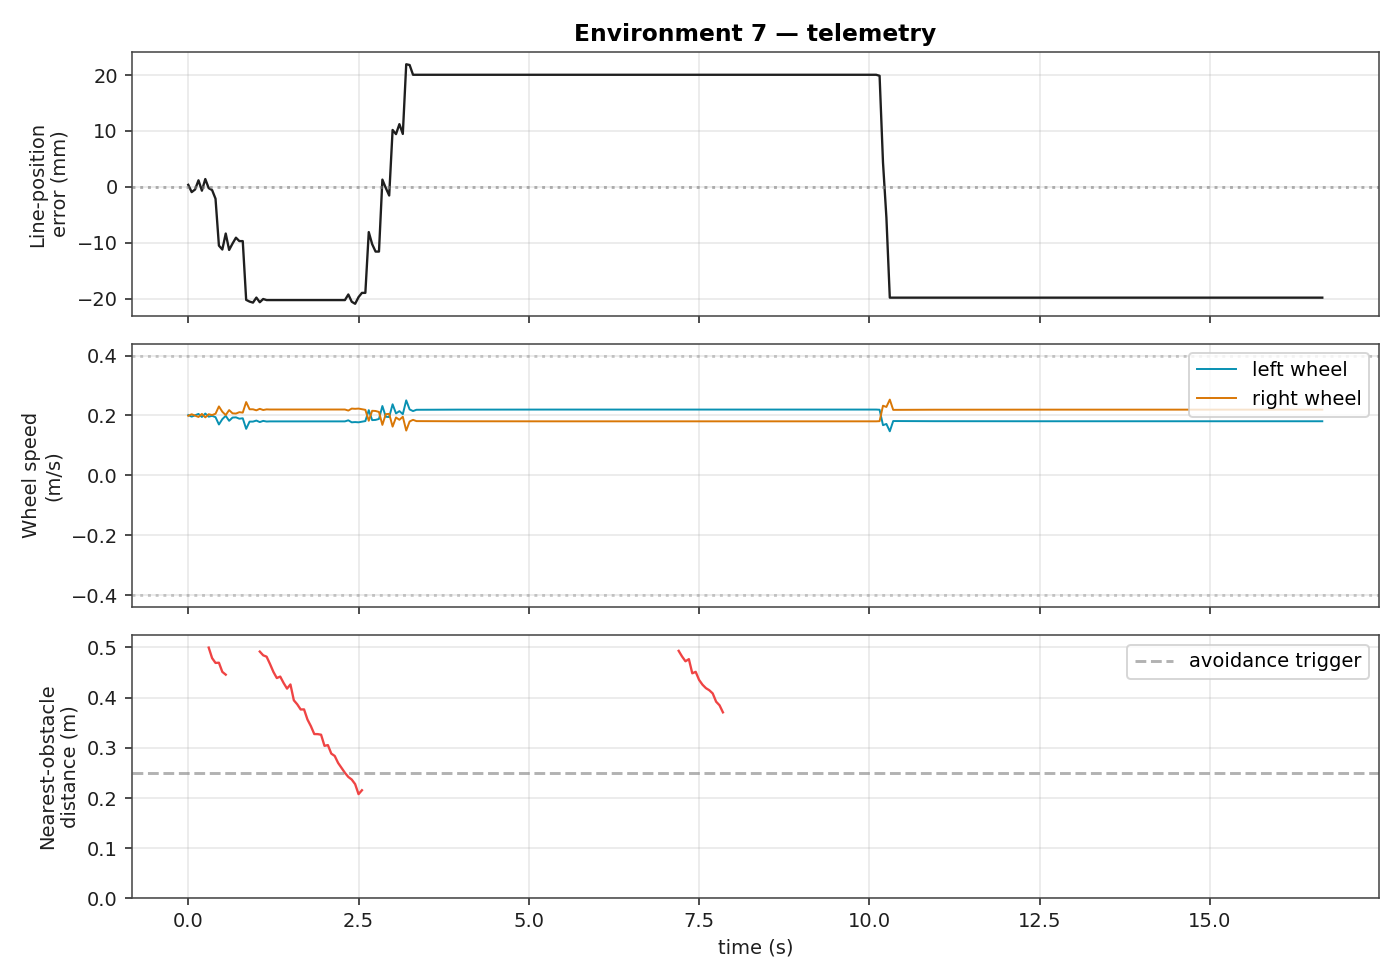
Environment 7 telemetry
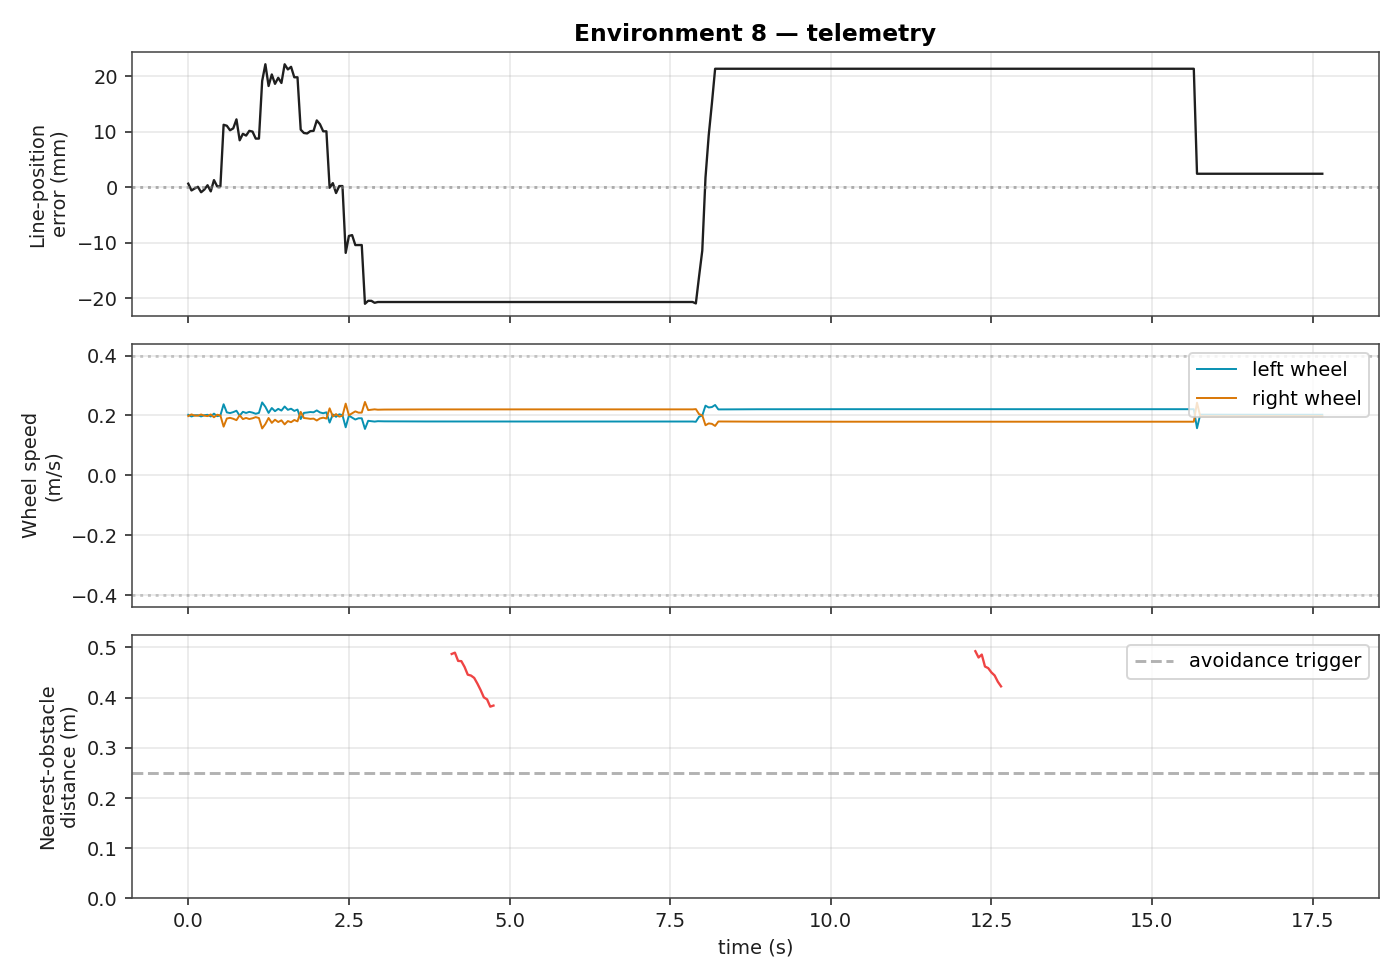
Environment 8 telemetry
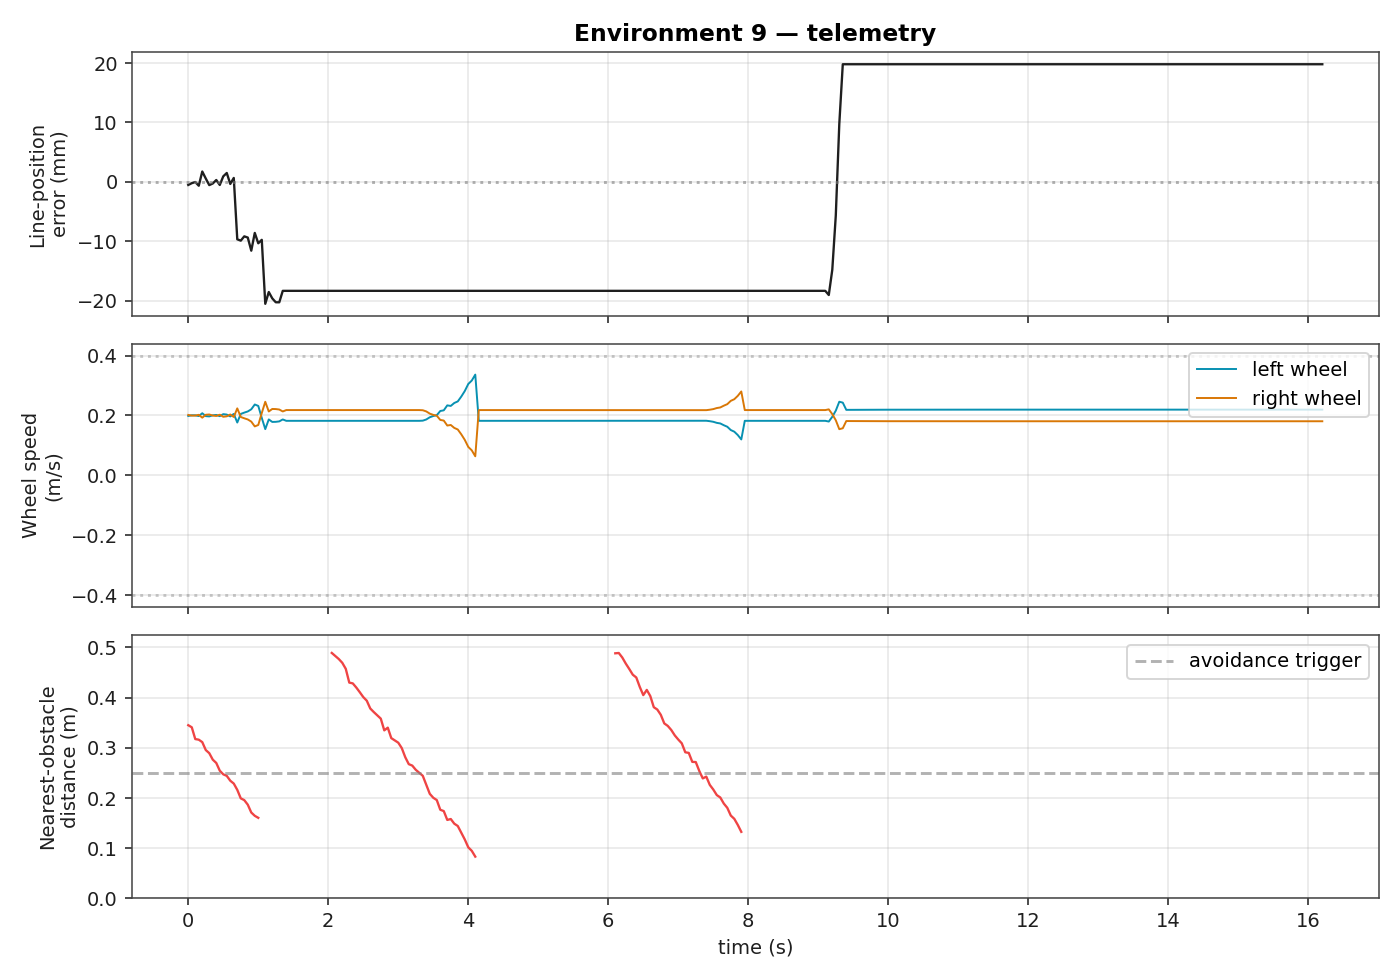
Environment 9 telemetry